

Attributes and Filter Options
Schools and Districts Panel
The Schools and Districts Panel allows the user to specify which schools and districts should be included in the report, as shown in figure 1. Results for students who tested at the school/district and meet the criteria set in the Assessment Attributes will be included.
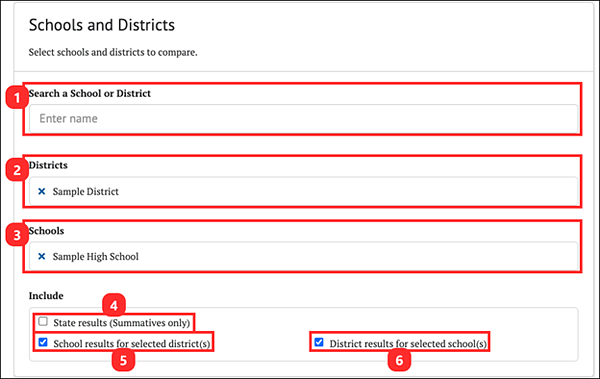
Figure 1. Schools and Districts Panel
The Schools and Districts panel contains the following actionable elements:
- Search a School or District: Search for the school(s) or district(s) to include in the report. Users with district-level permissions may select multiple schools or the entire district. Users with state-level permissions may select multiple schools and districts. This selection is disabled for users with single-school permissions.
- Districts: This displays the selected districts to be included in the report. Users with single-district permissions have their district preselected. This selection is disabled for users with single-school permissions.
- Schools: This displays the selected schools to be included in the report. Users with single-school permissions have their school preselected.
- [State results (Summative assessments only)]: If selected, the report will include summative assessment results for the state. Statewide results are only available for the school years that have been released to the public.
- [School results for selected district(s)]: If selected, the report will include the results for each school within each selected district. The data that is available to a user is dependent on the user’s access.
- [District results for selected schools]: If selected, the report will include a results summary for the district of each selected school. The data that is available to a user is dependent on the user’s access.
Assessment Attributes
The Assessment Attributes panel allows the user to define the report based on specific attributes. The report type selected determines the assessment attributes displayed (figure 2).
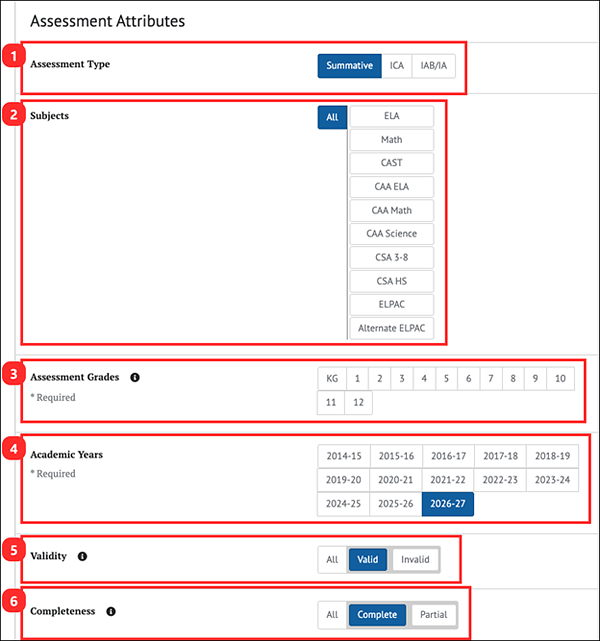
Figure 2. Assessment Attributes
The Assessment Attributes panel provides the following attribute selections:
- Assessment Type: The type of assessment for the report type. The choices are [Summative], [ICA], or [IAB/IA].
- Subjects: Subjects available for the report type. The choices are [ELA], [Math], [CAST], [CAA ELA], [CAA Math], [CAA Science], [CSA 3-8], [CSA HS], [ELPAC], and [Alternate ELPAC]. The [All] button causes the report to include results for all displayed subjects.
- Assessment Grades: Grade of the assessment. One or more grades must be selected. A report does not generate unless at least one grade is selected.
- For Target Reports, only a single grade may be selected.
- Longitudinal Reports track summative assessment performance for one student population as it progresses through different grade levels, so at least two grades must be selected for this report type.
- Academic Years: The administration year(s) included in the report. One or more academic years must be selected. A report does not generate unless at least one academic year is selected.
- For Target Reports, only a single year may be selected.
- For Longitudinal Reports, only a single year may be selected, and it represents the year for the highest assessment grade selected. For example, if the grades selected are three and four and the year is 2021–22, the results will include the population’s grade three results for 2020–21 and grade four results for 2021–22.
- Manner of Administration/Validity: The status of the assessment(s) results
- If the assessment type selected is an ICA, IAB, or IA, this attribute is Manner of Administration and defaults to [Standardized]. It can be toggled with [Nonstandardized] to view results for nonstandardized administration of the assessments only or to [All] to generate a report with both types of administration.
- If the assessment type is Summative, this attribute is Validity and defaults to [Valid]. It can be toggled to [Invalid] to view results for invalidated assessments only or to [All] to generate a report with both valid and invalid results. Currently in CERS, all assessment results are reported as valid, and do not display a label in the Status column.
- Completeness toggle: Indicates whether the assessment results meet the definition of complete. The default is [Complete], but it can be toggled to [Partial] for partial assessments or to [All] to generate a report that includes results from assessments that are either complete or partial. Summative and Interim Comprehensive Assessment (ICA) tests are considered “complete” if the student responded to all items on both the computer adaptive test (CAT) and performance task (PT). Interim Assessment Blocks (IABs) and Focused IABs (FIABs) are considered complete if the student answered all items in the test.
For a Claim/Domain Report, an additional [Claims or Domains] button appears in the Subjects panel. Selecting it opens a subpanel that allows specific claims or domains to be selected (figure 3).
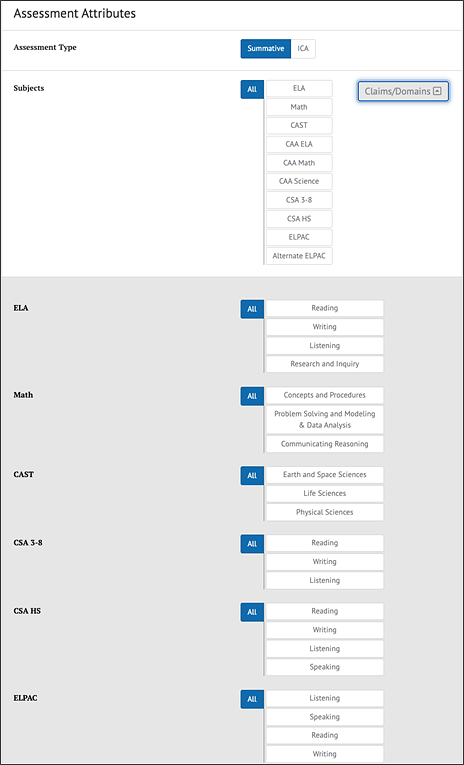
Figure 3. Claim/Domain Report
Only claims or domains from the included content areas can be selected, and only the selected claims or domains appear in the generated claim report. Users can also select [All] for each to display all claims or domains in the report. For example, if the selections were as shown in figure 3, the generated report would include all subjects and all of their related claims or domains.
Subgroups and Filters
The Filter panel contains two tabs, [Subgroups and Advanced Filters] and [Customize Subgroups]. These provide two different options for configuring how student performance data are categorized and how groups are filtered for inclusion in the report. These options are mutually exclusive, so only one of these panels should be configured. The generated report uses the setting from whichever tab is currently selected.
Subgroups
The Subgroups section of the [Subgroups and Advanced Filters] tab allows a user to disaggregate a report by all the student demographic values and program subgroups for comparison to the overall population, as shown in figure 4. The available subgroups that can be selected are [Race/Ethnicity], [English Language Acquisition Status], [Primary Language], and [Migrant Status].
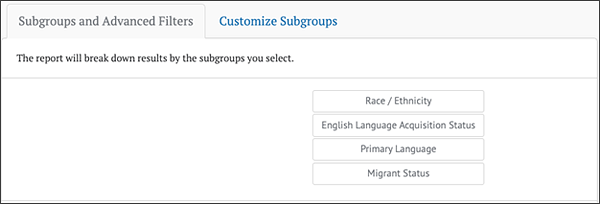
Figure 4. Subgroups
Advanced Filters
The Advanced Filters for student demographics section of the [Subgroups and Advanced Filters] tab can be displayed by selecting the [Show] button as shown in figure 5. Figure 6 displays how the Advanced Filters Panel appears. It is useful when a user wants to filter a report by one or more specific student subgroup combinations. The available filters are [Race/Ethnicity], [English Language Acquisition Status], [Primary Language], and [Migrant Status].
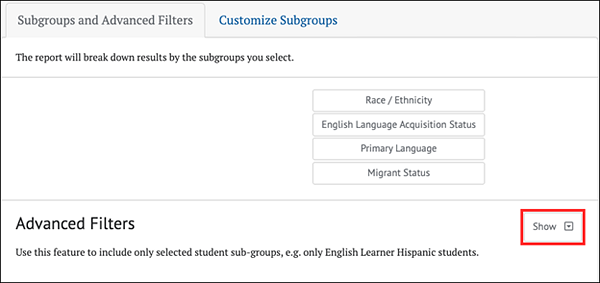
Figure 5. Show Button
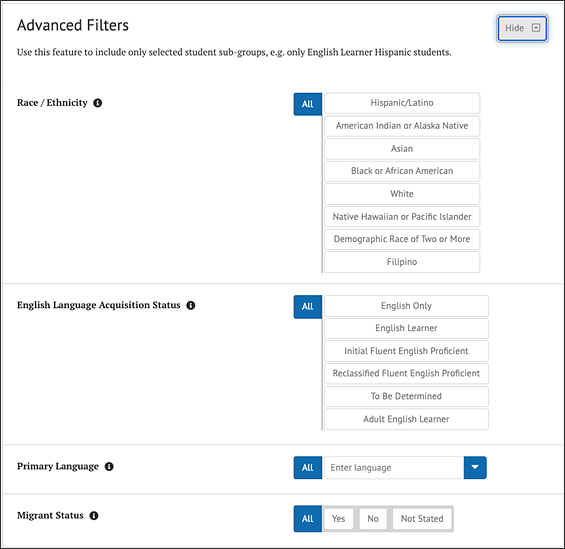
Figure 6. Advanced Filters
Customize Subgroups
Customized subgroups provide users the ability to control which student groups are included in the generated report and how the report data are categorized. It can be used in cases in which the Subgroups and Advanced Filters do not provide enough flexibility. The options are similar to the Advanced Filters for student demographics but allow multiple combinations to be defined (figure 7).
To customize subgroups:
- Configure a subgroup using the filters as if creating an Advanced Filters query.
- Select the [+Create Subgroup] button to add this group to the report.
- Repeat steps 1 and 2 to create additional subgroups.
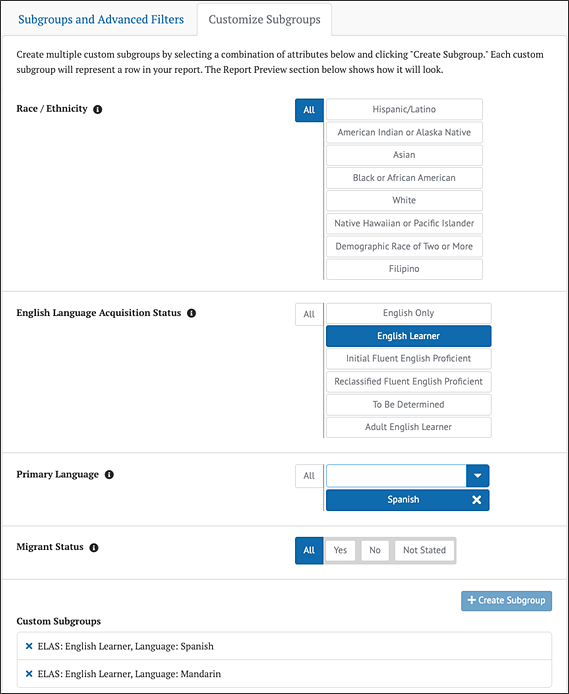
Figure 7. Customize Subgroups
The report includes a row with the results for each defined subgroup and overall totals for all test takers. The customized subgroup combinations do not need to be mutually exclusive. For example, one subgroup could be defined as all students whose primary language is [Spanish]. A second subgroup could be [English Learner] whose migrant status is [Yes]. Some students could fall into multiple subgroups depending on how the subgroups are defined, while others may not fall into any subgroups. Therefore, the subgroup totals will not always sum to the overall totals.