

System Features
With the exception of Accessibility Tools—which are available on all screens starting with first access to the Completion Status System—all Completion Status features described next are available from both the Home Page Dashboard screen, which appears at first logon to the Completion Status System and displays every task a user can perform within the system; and the primary menu bar, which is located on any page in the system.
Accessibility Tools
The Accessibility Tools feature, which is available on all screens, allows a user to change the saturation, text spacing, and cursor size on all Completion Status screens.
Take the following steps to use Accessibility Tools:
-
Select the Accessibility widget—the universal access icon that appears in the bottom-right corner of every screen—after initial logon (indicated in figure 1).
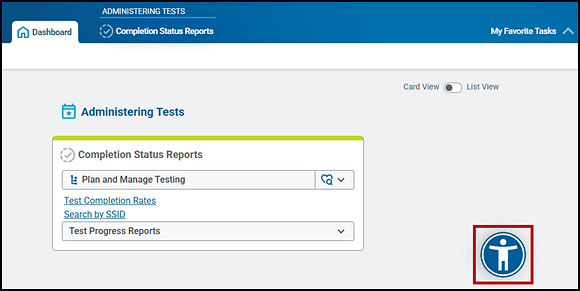
Figure 1. Universal access icon
- Change options using the Accessibility Tools panel that opens on the right of the screen by first using one or more toggles to indicate the screen settings and then changing a setting (figure 2). Available settings are as follows:
- Saturation
- Text Spacing
- Cursor
- Minimize Widget (to reduce the size of the universal accessibility icon and dock it to the bottom of the application window)
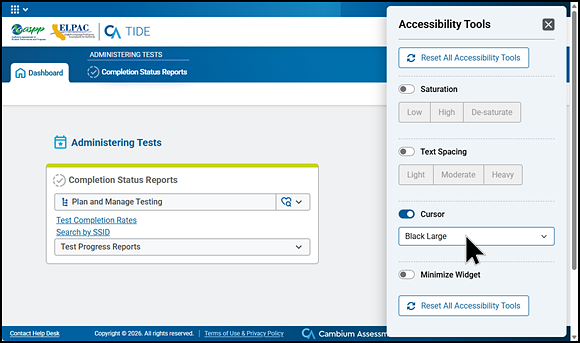
Figure 2. Accessibility Tools panel
- Use the [Reset All Accessibility Tools] button to start over or the “X” in the upper-right corner of the panel to save and exit Accessibility Tools.
Home Page Dashboard
Navigating Using Cards
The Home Page Dashboard, shown in figure 3, displays the “Administering Tests” task category with two types of Completion Status reports available for CAASPP and ELPAC testing: Plan and Manage Testing and Test Progress reports.
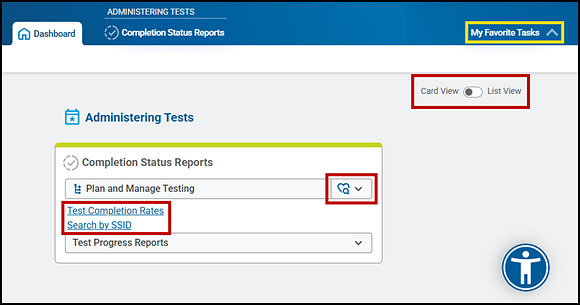
Figure 3. Home Page Dashboard screen (Card View)
Note the following about the Home Page Dashboard actions and features that are indicated in figure 3:
- Use the View toggle to change the screen view from the cards shown in figure 3 to a list view.
- Open the screen at any time by selecting the [Dashboard] tab on the upper-left side of any screen.
- Select the [Favorite Searches] heart-and-magnifying-glass [
 ] icon to access a list of searches that were previously marked as favorites when creating a Plan and Manage Testing Report.
 - Select a link for [Test Completion Rates] to directly open the Test Completion Rates screen or [Search by SSID] to directly open the Search by SSID screen.
- Select the My Favorite Tasks drop-down list to access tasks that were previously selected as favorites.
Select the [Plan and Manage Testing] button to open the Plan and Manage Testing screen or [Test Progress Reports] to open the Test Progress Summary screen.
For Test Progress Reports, selecting the button opens a drop-down list. Selecting the Test Progress Summary option opens the screen to start creating a Test Progress Summary report.
Navigating Using the [Completion Status Reports] Tab
Alternatively, hovering over the [Completion Status Reports] tab opens a selectable list to open screens to create reports using the following options (figure 4):
- Plan and Manage Testing
- Test Completion Rates
- Search by SSID
- Test Progress Summary
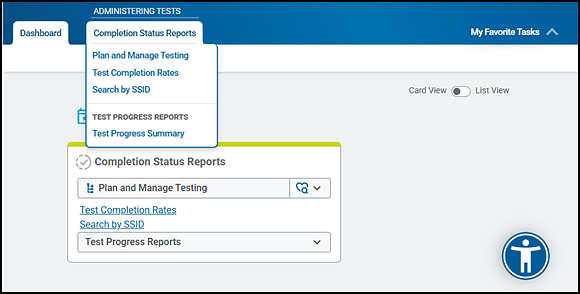
Figure 4. [Completion Status Reports] tab on the Home Page Dashboard screen
Header with General Tools
The header, presented in figure 5, is located at the top of the screen and provides functions for a variety of general tools that can be used by the user currently logged on to the system.
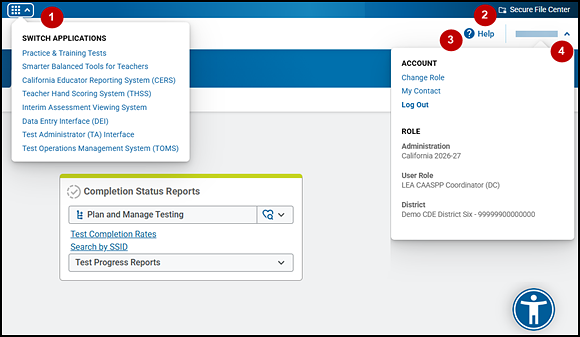
Figure 5. Header at the top of the Completion Status application
Refer to table 1 for descriptions of the features called out in the application header section presented in figure 5.
| Callout Number | Feature | Description |
|---|---|---|
|
1 |
Switch Applications drop-down list |
This drop-down list, which is opened by selecting the [Switch Applications] 3×3 array [ |
|
2 |
[Secure File Center] button |
This button, which is shaped like a file folder [ |
|
3 |
[Help] button |
This button, which is shaped like a question mark [ |
|
4 |
[Name] drop-down list |
This drop-down list has a section with account management functions such as those to change a user role and log out; as well as a section describing the user’s role, including the test administration and user’s district (LEA) and school. Refer to the Overview section in the TOMS User Guide for more information about managing a TOMS SSO account. |
 ] icon, contains other applications, such as CERS and the Test Administrator Interface, that a user can access according to their TOMS user role.
 ], opens the Secure File Center, which houses requested reports after they have been generated.
 ], displays an online help guide from which users can navigate to Help screens for specific needs. The Guide will open in a new web browser tab.
Action Bar
The action bar, shown in figure 5, appears when a user navigates away from the Home Page Dashboard screen by selecting a report option on the Dashboard. There are three features of note:
- The [Dashboard] tab that takes the user to the Home Page Dashboard, shown in figure 3, from any page within the system
- The links to create a Completion Status Report, which are part of the action bar and indicated in figure 6:
- Plan and Manage Testing Report
- Test Completion Rates
- Search by SSID
-
The Test Progress Reports drop-down list, which is also part of the action bar, allows users to select the Test Progress Summary.
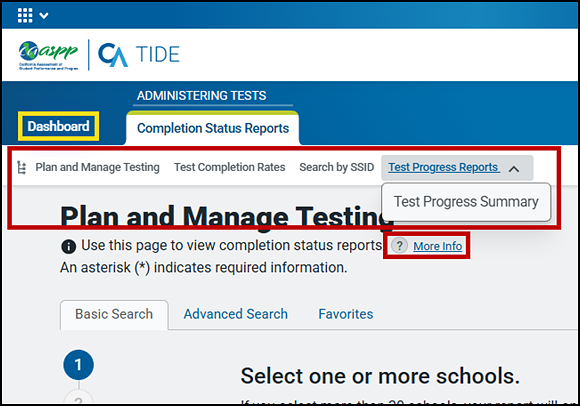
Figure 6. Action bar features
-
The [More Info] link, shown under a report-type heading and also indicated in figure 6, toggles the instructions on how to perform a task. The sample screen shown in figure 7 demonstrates how this content is presented on the Plan and Manage Testing Report screen. Select this link again to collapse the instructions.
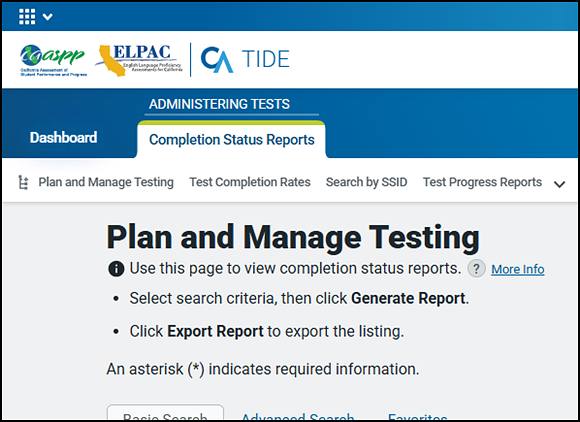
Figure 7. More Info content for the Plan and Manage Testing screen
My Favorite Tasks
Use the My Favorite Tasks option to mark a task as a favorite, open a list of favorite tasks, or open a task marked as a favorite. Any report category (such as Plan and Manage Testing) can be marked as a favorite.
The following features are called out in figure 8:
- When a report category is open, select the [Favorite This Task] link to mark it as a favorite.
- Select the My Favorite Tasks drop-down list to view the list of tasks.
-
Select a link above the My Favorite Tasks drop-down list to navigate to that task.
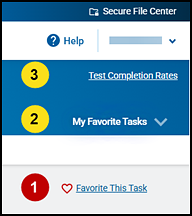
Figure 8. My Favorite Tasks links
To remove an item from the list, open the linked report category and select the [Un-Favorite This Task] link.