Smarter Balanced Summative Assessment Results for ELA and Math
The group view provides an aggregate and individual display of a selected assessment for an assigned group, a custom group, or a school. Refer to the View Student Group Assessment Results section for details.
Once a user selects a summative assessment to display in the group view, the Results page displays as shown in figure 1.
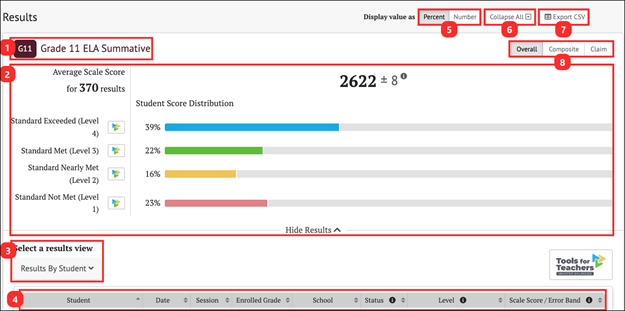
Figure 1. Summative Assessment Results Page
The Results page for a Smarter Balanced summative assessment displays the following information and elements:
- Name and grade of the assessment
- Group Aggregate panel: Displays aggregated data for the selected group of students
- Select a results view drop-down menu: Offers the following options for display results:
- [Results By Student] (default view)
- [Writing Trait Scores] (for ELA only)
- [Target Report] (for summative assessments only; student groups of 30 more)
- [Lexile Report] (for ELA only) or [Quantile Report] (for math only)
- Results View table
- Display value as field: Contains a toggle that allow a user to change the display to show the Student Score Distribution in percentages of students or numbers of students in each reporting category
- [Collapse All] button: Hides the Results View table for all the displayed assessments and toggles to an [Expand All] button, which displays the results again
- [Export CSV] button: Export all the student’s test history to a comma-separated value (CSV) file for download.
- [Overall/Composite/Claim] toggle: Switches among Overall, Composite, and Claim
- The [Overall] toggle displays the Student Score Distribution with four achievement levels.
- The [Composite] toggle displays the Student Composite Claim Score Distribution across three score categories.
- The [Claim] toggle displays four claims with three reporting categories.
Smarter Balanced Summative Assessment Group Results
The Smarter Balanced summative assessments report achievement Overall, by Composite Claim, and by Claim.
The group Results page for a Smarter Balanced summative assessment is displayed in figure 2. For Overall results, the [Overall] toggle displays the Student Score Distribution with four achievement levels (figure 2).
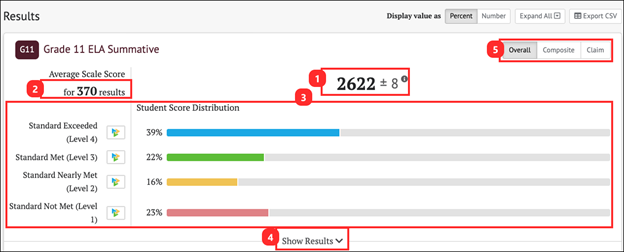
Figure 2. Overall Group Results for ELA Summative Assessment
The Group Aggregate panel for a Smarter Balanced summative assessment Overall result displays the following information and elements:
- Average Scale Score: Average scale score for the selected group of students and an error band based on the Standard Error of the Mean
- Total student test results collected to calculate average scale score and score distribution
- Student Score Distribution: Score distribution for the performance levels of the overall score
- [Show/Hide Results] button: Displays the Results View table for the assessment and toggles to a [Hide Results] button that hides the table
- [Overall/Composite/Claim] toggle: Switches among Overall, Composite, and Claim
Composite Claim Group Results: Smarter Balanced Summative Assessment
The composite claims for the summative assessment for English language arts/literacy (ELA) are:
- Composite Claim 1: Reading and Listening—Students can comprehend, by reading or listening closely and analytically, a range of increasingly complex literary and informational texts.
- Composite Claim 2: Writing and Research—Students can produce organized and focused written texts for a range of purposes and audiences and can apply research and inquiry skills to investigate topics and analyze, integrate, and present information.
The composite claims for the summative assessment for mathematics are:
- Composite Claim 1: Concepts and Procedures—Students can explain and apply mathematical concepts and interpret and carry out mathematical procedures with precision and fluency.
- Composite Claim 2: Mathematical Practices (Problem Solving, Communicating Reasoning, and Modeling and Data Analysis)—Students can use problem-solving strategies and mathematical models to represent, analyze, and solve complex, well‐formed or not yet fully formed problems that are presented in mathematical or real‐world contexts; make productive use of mathematical concepts, procedures, and tools; interpret results; and communicate clearly and precisely about their own reasoning and the reasoning of others.
The [Composite] toggle displays two composite claims: Reading and Listening, and Writing and Research, each with three reporting categories (Below Standard, At or Near Standard, or Above Standard) as shown in figure 3.
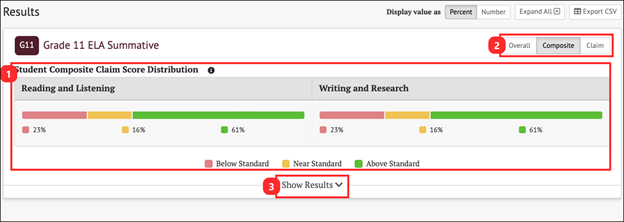
Figure 3. Composite Claims Group Results for ELA Summative Assessment
The Group Aggregate panel for composite claim results displays the following information and elements:
- Student Composite Claim Score Distribution: Displays claim level distributions for the selected group of students
- [Overall/Composite/Claim] toggle: Switches among Overall, Composite, and Claim
- [Show/Hide Results] button: Displays the Results View table for the assessment and toggles to a [Hide Results] button, which hides the table
Overall Claim Results: Smarter Balanced Summative Assessment
Results in the [Claim] tab will display “No Scores Reported” (figure 4) if students completed the adjusted blueprint of the Smarter Balanced Summative Assessments for ELA and Mathematics. Refer to the [Composite] tab for composite claim results.
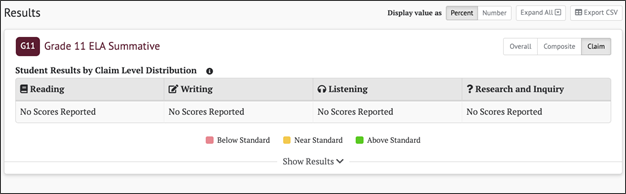
Figure 4. Student Results by Claim Level with No Scores Reported
Smarter Balanced Summative Assessment Results By Student
The Results View for Smarter Balanced summative assessment results can be toggled to show Overall, Composite, and Claim results. Overall is the default selection.
Student Overall Scores
When the [Overall] button is selected, the Results By Student table includes the information elements for each student shown in figure 5.
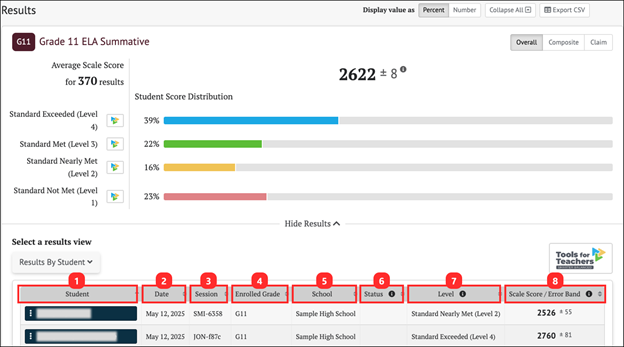
Figure 5. Summative Assessment Results By Student Overall Scores
The table includes the following information for each student:
- Student: Student’s full name with a Context Menu three-dot icon [⋮] that provides access to additional student details (refer to the Summative Student Options section)
- Date: Date student completed the assessment
- Session: Testing session identifier (applicable to interim assessments only)
- Enrolled Grade: Student’s enrolled grade at the time of the assessment
- School: Student’s assigned school at the time of the assessment
- Status: The assessment status describes whether the administration condition (Manner of Administration) was Valid or Invalid. A blank Status field indicates a valid assessment status. Currently in CERS, all assessment results are reported as valid.
- Level: Student’s achievement level on the assessment: Standard Not Met (Level 1), Standard Nearly Met (Level 2), Standard Met (Level 3), Standard Exceeded (Level 4)
- Scale Score/Error Band: Student’s scale score and error band based on the Standard Error of Measurement (SEM) associated with that score
Student Composite Claim Level Scores
When the [Composite] button is selected (figure 6), the Results View panel changes to show each student’s assessment results by Composite Claim. Return to the default view by selecting the [Overall] button.
The Student Composite Claim Level Distribution panel (figure 6) displays the number or percentage of students scoring in each reporting category (Below Standard, Near Standard, or Above Standard) for each claim.
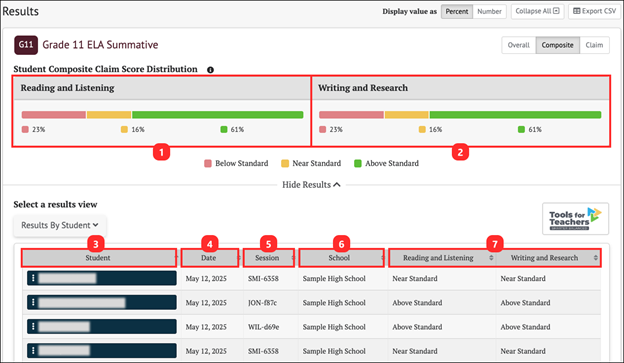
Figure 6. Summative Assessment Results By Student Composite Claim
The table includes the following information for each student:
- Reading and Listening: A chart to show the student composite claim score distribution for Reading and Listening.
- Writing and Research: A chart to show the student composite claim score distribution for Writing and Research.
- Student: Student’s full name with a Context Menu three-dot icon [⋮] that provides access to additional student details (refer to the Summative Student Options section)
- Date: Date student completed the assessment
- Session: Test session identifier (applicable to interim assessments only)
- School: Student’s assigned school at the time of the assessment
- Composite Claims for the selected assessment: Student performance for each composite claim is described as Above Standard, Near Standard, or Below Standard
The adjusted blueprints do not allow for individual student claim-level scores to be reported because there are not enough items in each claim to report on them with precision. Starting with 2023–24 results, composite claim results are reported for the Smarter Balanced Summative Assessments for ELA and Mathematics.
Student Claim Level Scores
When the [Claim] button is selected, the Results View panel changes to show each student’s assessment results by Claim, as shown below. Return to the default view by selecting the [Overall] button.
The Student Claim Level Distribution table displays the number or percentage of students scoring in each reporting category (Below Standard, Near Standard, or Above Standard) for each claim.
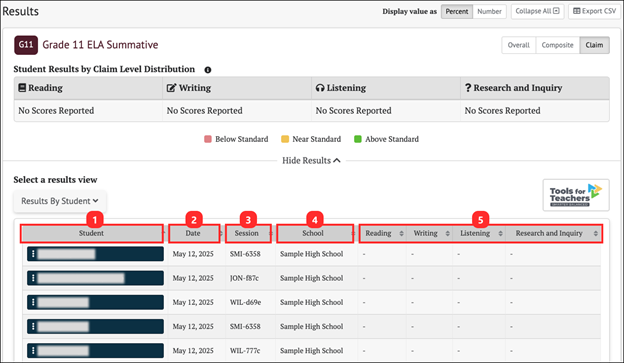
Figure 7. Summative Results By Student Claim Level Scores
Each student’s result in the Claim Scores table shows the following elements:
- Student: Student’s full name with a Context Menu three-dot icon [⋮] that provides access to additional student details (refer to the Summative Student Options section)
- Date: Date student completed the assessment
- Session: Test session identifier (applicable to interim assessments only)
- School: Student’s assigned school at the time of the assessment
- Claims for the selected assessment: Student performance on each claim is described as Above Standard, Near Standard, or Below Standard
Summative Student Options
When the Context Menu three-dot icon [⋮] next to a student’s name is selected, the Student Options pop-up menu opens (figure 8).
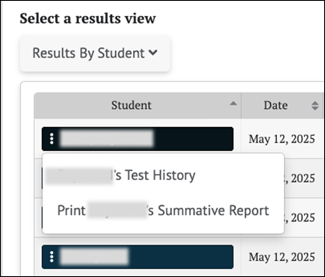
Figure 8. Student Options Pop-Up
The menu options for each student are:
- [Student’s Test History]: This displays the test history of the student. Refer to the Student Test History Report section for details.
- [Print Student’s Summative Report]: Links to a printable Individual Student Report (ISR) in PDF format. Filter selections are automatically filled for some fields, such as the assessment type, subject, and school year. Refer to the Printable Reports section for details.
Smarter Balanced Summative Writing Trait Scores
The Writing Trait Scores view (figure 9) for Smarter Balanced ELA summative results displays a table of aggregate student results grouped by writing purpose (Argumentative, Explanatory, Informational, Narrative, or Opinion). Individual student writing trait scores are available in the individual student report (ISR) PDF. Refer to the Printable Reports section for details.
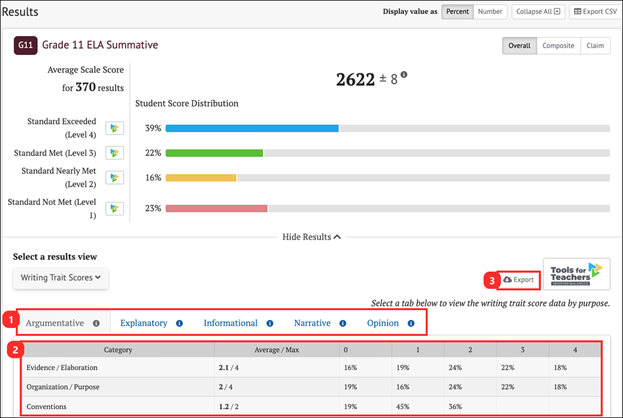
Figure 9. Writing Trait Scores
The Writing Trait Scores table shows the following elements:
- Writing Purpose tabs: The tabs display based on student results. Selecting a writing purpose displays a table with aggregated student results.
- Points Distribution Table: Each table row lists the category of writing performance, or writing trait (Evidence/Elaboration, Organization/Purpose, and Conventions), the group average and maximum points for that category, and the percentage/number of students who earned each number of points for that category.
- Category: Rows list the category of writing performance or writing trait (Evidence/Elaboration, Organization/Purpose, and Conventions)
- Average/Max: The average and maximum points earned by students in the group for that category.
- 0, 1, 2, 3, etc. : Percentage or number of students who earned each number of points for that category.
- [Export] button: Available to export the results table to a comma-separated value (CSV) file. All available tabs will be included in the report.
Writing Extended Response (WER) Condition Codes for ELA
Writing Extended Response (WER) Condition Codes are used for responses to full-write essay items –an example of an ELA performance task– that cannot be scored because of the nature of the student’s response. A detailed description of each available condition code is provided in table 1.
When a student response is assigned a condition code, it is equivalent to a score of zero, except for the Off-Purpose code. In most cases, when a full-write response receives a condition code, that code is assigned to all three dimensions of the response. However, beginning with the 2022–23 test administration, if the condition code for a response is Off-Purpose, only the Evidence/Elaboration and Organization/Purpose dimensions are assigned Off-Purpose, and the Conventions dimension is still scored. The Conventions item score is included in the total ELA score and the writing claim score. The rule for Off-Purpose scoring of Conventions is applied regardless of the genre of the writing prompt.
| Condition Code | Description |
|---|---|
|
Blank (B) |
Student did not enter a response. |
|
Insufficient (I) |
Student has not provided a meaningful response; examples can include:
Responses where the student’s original work is insufficient to determine whether the student is able to organize, cite evidence and elaborate, and use conventions as defined in the rubrics; or the response is too brief to determine whether it is on purpose or on topic. |
|
Non-scorable Language (L) |
ELA: language other than English Mathematics: language other than English or Spanish |
|
Off-Topic (T) |
A student response will be judged as off topic when it is unrelated to the task or the sources, or when the response shows no evidence that the student has read the task or the sources (especially for informational/explanatory and opinion/argumentative). Off-topic responses are generally substantial responses. |
|
Off-Purpose (M) |
A student response will be judged as off purpose when the student has clearly not written to the purpose designated in the task. An off-purpose response addresses the topic of the task but not the purpose of the task. Off-purpose responses are generally developed responses (essays, poems, etc.) clearly not written to the designated purpose. If the condition code for a response is “off purpose,” only the evidence/elaboration and organization/purpose dimensions are assigned “off purpose,” and the conventions dimension is still scored. |
Lexile® and Quantile® Measures
Lexile® and Quantile® measures and ranges are derived from student scores on the Smarter Balanced ELA and Mathematics assessments. CERS contains Lexile measures and ranges for Smarter Balanced ELA summative assessments and ICAs. Quantile measures and ranges are available for Smarter Balanced math summative assessments and ICAs.
Lexile Measures for ELA Summative Assessments
Lexile Measures in Group View
Any group view will provide access to individual student Lexile results by selecting a student’s name and selecting [Student’s Test History] from the context menu. After selecting a summative ELA assessment, the toggle buttons will include an option to select Lexile results. Refer to the View Student Assessment Results by School and Grade section or the View Student Group Assessment Results section for details.
Once a user selects an ELA summative assessment to display in the group view, the Results page displays the [Results by Student] view by default. Selecting [Lexile Report] from the Select a results view drop-down list (figure 10) will display the Lexile Report page (figure 11).
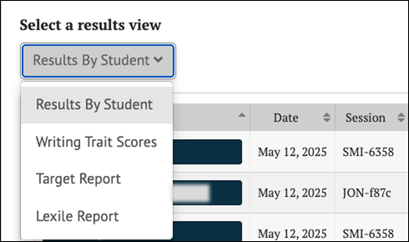
Figure 10. Select a Results View for Lexile Report
When the Select a results view drop-down list is selected, as shown in figure 11, the Lexile Report appears. The options for each view are:
- [Results by Student] (default view)
- [Writing Trait Scores] (for ELA only)
- [Target Report] (for summative assessments only; student groups of 30 or more)
-
[Lexile Report] (for ELA only)
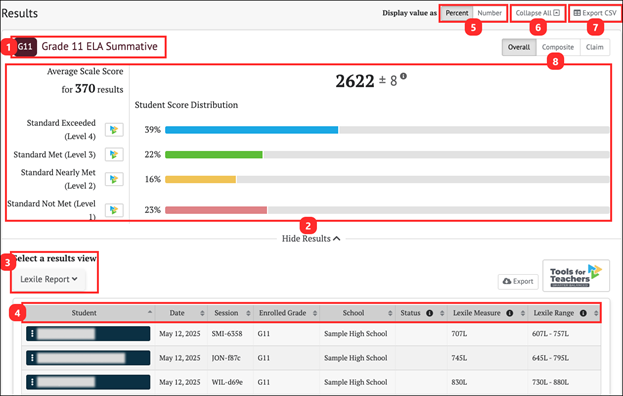
Figure 11. Lexile Report Display
The Lexile Report display for a Smarter Balanced ELA Summative displays the following information and elements:
- The name and grade of the assessment
- The Group Aggregate panel displays aggregate data for the selected group of students
- The Select a results view drop-down menu offers the following options for display results:
- [Results by Student] (default view)
- [Writing Trait Scores] (for ELA only)
- [Target Report] (for summative assessments only; student groups of 30 or more)
- [Lexile Report] (For ELA Only)
- The Results View table
- The Display value as field contains a toggle allowing a user to change the display to show the Student Score Distribution in percentages of students or numbers of students in each reporting category.
- The [Collapse All] button, which hides the Results View table for all the displayed assessments and toggles to an [Expand All] button, which displays the results again
- The [Export CSV] button, which exports all the student’s test history to a comma-separated value (CSV) file for download.
- Toggle buttons to switch between performance scores: [Overall] and [Claim]
- The [Overall] toggle displays the Student Score Distribution with four achievement levels.
- The [Claim] toggle displays four claims with three reporting categories.
Lexile Measure and Range
When the [Lexile Report] is selected, the Results page displays the following information and elements (figure 12).
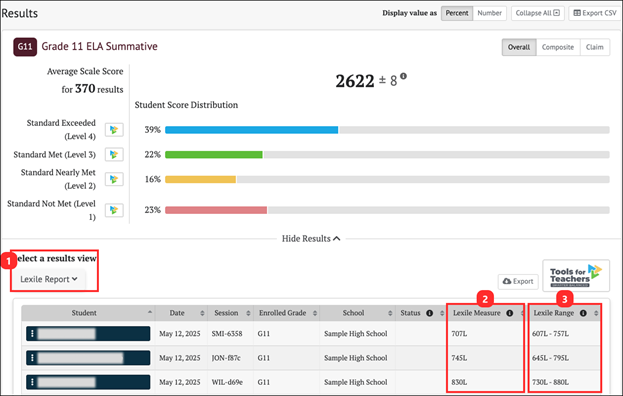
Figure 12. Lexile Measure and Lexile Range
- The Select a results view drop-down menu offers the following options for display results:
- [Results By Student] (default view)
- [Writing Trait Scores] (for ELA only)
- [Target Report] (for summative assessments only; student groups of 30 or more)
- [Lexile Report] (for ELA only)
- Lexile Measure: A student’s Lexile measure represents the student’s ability to read independently on a scale from below 0L to above 1600L.
- Lexile Range: A student’s Lexile range is 50L above and 100L below the student’s Lexile measure.
Lexile Measures By Student
Individual student Lexile results can be accessed from any group view by selecting a student’s name and selecting [Student’s Test History] from the context menu. After selecting a summative ELA assessment, the toggle buttons will include an option to select Lexile results. Refer to the View Student Assessment Results by School and Grade section or the View Student Group Assessment Results section for details. Also, refer to the View Individual Student Results section for more information.
From the Student Test History Page, identify a summative assessment for ELA and select the test results card. Refer to Student Test History Report Results section for more information.
When the [Lexile] toggle is selected, a table with the student’s Lexile measures on the selected assessment is displayed (figure 13).
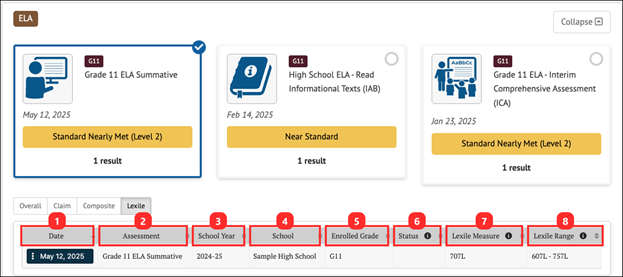
Figure 13. Lexile Measures Table
The Lexile table includes the following information for each student:
- Date: Date student completed the assessment
- Assessment: Name of Assessment
- School Year: School year for assessment
- School: Student’s assigned school at the time of the assessment
- Enrolled Grade: Student’s enrolled grade at the time of the assessment
- Status: For interim assessments, assessment status includes whether the Manner of Administration was Standardized or Non-standardized, or if the assessment was marked Partial or Complete (Completeness). For summative assessments, assessment status only includes whether the assessment administration (Manner of Administration) was Valid or Invalid. An empty field for a summative assessment indicates a valid assessment status. Currently in CERS, all assessment results are reported as valid.
- Lexile Measure: A student’s Lexile measure represents the student’s ability to read independently on a scale from below 0L to above 1600L.
- Lexile Range: A student’s Lexile range is 50L above and 100L below the student’s Lexile Measure.
Quantile Measures for Math Summative Assessments
Quantile Measures in Group View
Any group view will provide access to individual student Quantile results by selecting a student’s name and selecting [Student’s Test History] from the context menu. After selecting a summative math assessment, the toggle buttons will include an option to select Quantile results. Refer to the View Student Assessment Results by School and Grade section or the View Student Group Assessment Results section for details.
Once a user selects a summative math assessment to display in the group view, the Results page displays the [Results by Student] view by default. Selecting [Quantile Report] from the Select a results view drop-down list (figure 14) will display the Quantile Report page (figure 15).
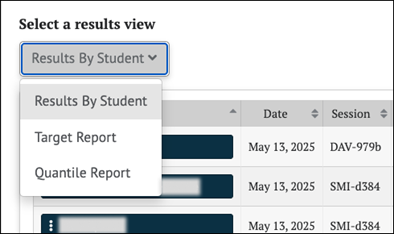
Figure 14. Select a Results View for Quantile Report
When the Select a results view drop-down list is selected, as shown in figure 14, the Quantile Report appears. The options for each view are:
- [Results by Student] (default view)
- [Target Report] (for summative assessments only; student groups of 30 or more)
-
[Quantile Report] (for math only)
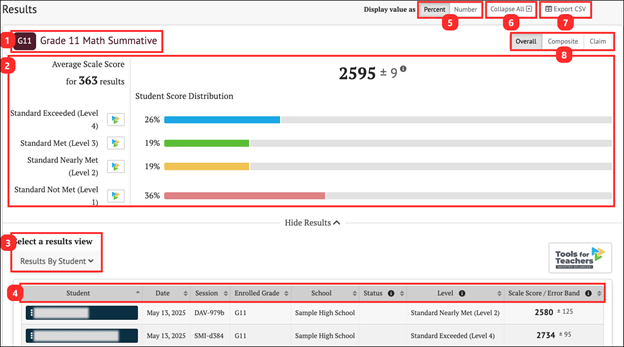
Figure 15. Quantile Report Display
The Quantile Report display for a math summative displays the following information and elements:
- The name and grade of the assessment
- The Group Aggregate panel displays aggregate data for the selected group of students
- The Select a results view drop-down menu offers the following options for display results:
- [Results by Student] ( default view)
- [Target Report] (for summative assessments only; student groups of 30 or more)
- [Quantile Report] (for math only)
- The Results View table
- The Display value as field contains a toggle allowing a user to change the display to show the Student Score Distribution in percentages of students or numbers of students in each reporting category.
- The [Collapse All] button, which hides the Results View table for all the displayed assessments and toggles to an [Expand All] button, which displays the results again
- The [Export CSV] button, which exports all the student’s test history to a comma-separated value (CSV) file for download.
- Toggle buttons to switch between performance scores: [Overall] and [Claim]
- The [Overall] toggle displays the Student Score Distribution with four achievement levels.
- The [Claim] toggle displays four claims with three reporting categories.
Quantile Measure and Range
When the [Quantile Report] is selected, the Results page displays the following information and elements (figure 16).
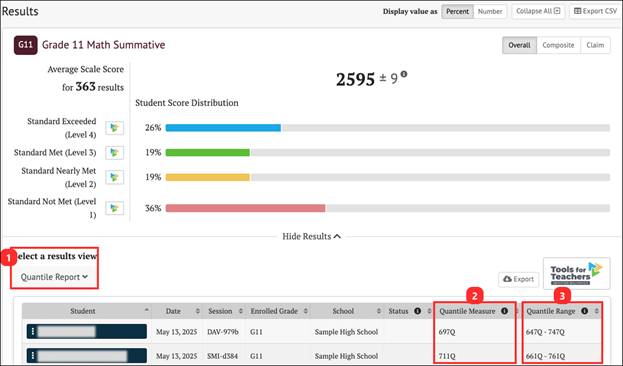
Figure 16. Quantile Measure Range View
- The Select a results view drop-down menu offers the following options for display results:
- [Results By Student] (default view)
- [Target Report] (for summative assessments only; student groups of 30 or more)
- [Quantile Report] (for math only)
- Quantile Measure: A student’s Quantile Measure represents the student’s readiness for mathematics instruction on a scale from below 0Q to above 1600Q.
- Quantile Range: A student’s Quantile Range is 50Q above and 50Q below the student’s Quantile Measure.
Quantile Measures By Student
Individual student Quantile results can be accessed from any group view by selecting a student’s name and selecting [Student’s Test History] from the context menu. After selecting summative math assessment, the toggle buttons will include an option to select Quantile results. Refer to the View Student Assessment Results by School and Grade section or the View Student Group Assessment Results for more information. Also, refer to the View Individual Student Results section for more information.
From the Student Test History Page, identify a summative assessment for math and select the test results card. Refer to Student Test History Report Results section for more information.
When the [Quantile] toggle is selected, a table with the student’s Quantile measures on the selected assessment is displayed (figure 17).
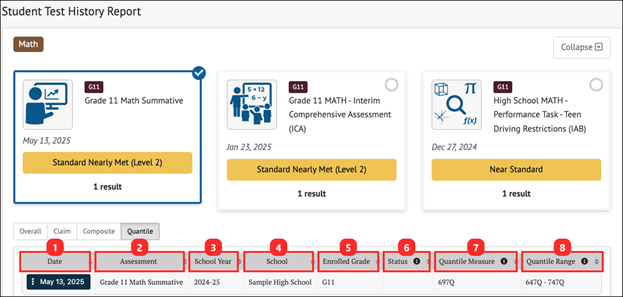
Figure 17. Quantile Measures Table
The Quantile table includes the following information for each student:
- Date: Date student completed the assessment
- Assessment: Name of Assessment
- School Year: School year for assessment
- School: Student’s assigned school at the time of the assessment
- Enrolled Grade: Student’s enrolled grade at the time of the assessment
- Status: For interim assessments, assessment status includes whether the assessment Manner of Administration was Standardized or Non-standardized, or if the assessment was marked Partial or Complete (Completeness). For summative assessments, assessment status only includes whether the assessment administration (Manner of Administration) was Valid or Invalid. An empty field for a summative assessment indicates a valid assessment status. Currently in CERS, all assessment results are reported as valid.
- Quantile Measure: A student’s Quantile measure represents the student’s readiness for mathematics instruction on a scale from below 0Q to above 1600Q.
- Quantile Range: A student’s Quantile range is 50Q above and 50Q below the student’s Quantile measure.
Smarter Balanced Summative Target Reports
Each Smarter Balanced Claim for English language arts/literacy and mathematics includes a set of assessment targets that provide more detail about the expectations of the knowledge, skills, and/or abilities assessed by the items and tasks within each claim.
- For English language arts/literacy (Figure 18), the summative assessment target-level scores are calculated for each claim.
- For mathematics, target-level scores are calculated for Claim 1 only.
CERS displays aggregate target-level reports for each summative assessment. Target scores are reported as Performance Relative to the Entire Test and Performance Relative to Level 3 (Standard Met).
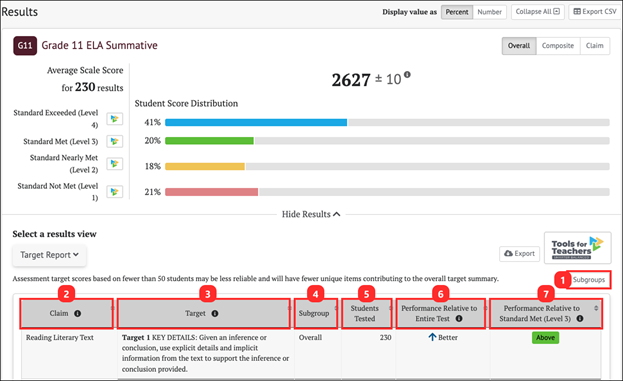
Figure 18. Target Report
The Target Report table includes the following information:
- [Subgroups] button: Disaggregates the target report by student demographic or program group
- Claim: The Claim(s) associated with the assessment subject
- Target: The Targets associated with each Claim
- Subgroup: The student subgroup breakdown of the report
- Students Tested: The number of students who answered questions related to the target
- Performance Relative to Entire Test: The overall student Performance Relative to the Entire Test (Better, Similar, or Worse)
- Performance Relative to Met Standard (Level 3): The overall student Performance Relative to Level 3 (Below, Near, or Above) (Figure 19)
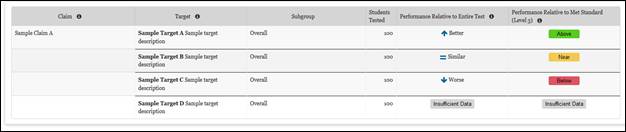
Figure 19. Target Report Table Indicators
Performance Relative to the Entire Test
Performance Relative to the Entire Test is reported in one of three reporting categories: Better, Similar, or Worse. This report indicates whether students’ performance on a target was better than, the same, or worse than the students’ performance on the entire test. A "Worse" indicator does not necessarily mean poor performance on a target, but rather that students’ performance in this area was weaker than the overall performance.
Performance Relative to Level 3
Performance Relative to Level 3 (Met Standard) is reported in one of three reporting categories: Above, Near, or Below. This report Indicates whether students’ performance on a target was above, near, or below the performance standard (Level 3: Met Standard). A "Below" indicator suggests that students have not yet mastered the content assessed in a target; however, the students’ overall performance on the test may be near or above standard.
Assessment Target Reports Frequently Asked Questions
How Are Smarter Balanced Scores Reported?
Smarter Balanced uses an evidence-centered design to develop assessment items aligned with the Common Core State Standards (CCSS) for English language arts/literacy (ELA) and Mathematics. That design results in a hierarchical scoring and reporting system that includes an overall scale score and achievement level, claim performance levels, and target reports. If the overall scale score and achievement level is the broadest measure of student achievement, the assessment target report represents a more detailed, or granular, level of summative assessment data available to educators. This is presented graphically in figure 20.
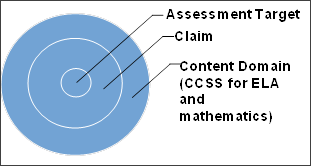
Figure 20. Hierarchical Scoring and Reporting System Design
What Is the Hierarchy of Scores and Reporting?
To maximize the use of assessment results, it is important to understand the Smarter Balanced hierarchical scoring and reporting system. Using these reports together will help inform instruction.
Scale Score and Achievement Level
For the first level in the hierarchy, each student receives a total score, expressed as a four-digit overall scale score and one of four achievement levels for each content area. The possible achievement levels are Standard Exceeded (Level 4), Standard Met (Level 3), Standard Nearly Met (Level 2), and Standard Not Met (Level 1).
Claims
For the second level in the hierarchy, the student’s performance on each claim is represented by one of three performance levels—Below Standard, Near Standard, or Above Standard. A claim is a statement about what a student knows or is able to do. Smarter Balanced has identified four claims specific to ELA and four claims for mathematics that focus on what students are expected to know and be able to do at each grade level. Claims can include more than one target. All claims and targets—as well as assessment blueprints and other test development resources—can be found in the Smarter Content Explorer.
Example of a Mathematics Claim
Concepts and Procedures Claim #1:
Students can explain and apply mathematical concepts and carry out mathematical procedures with precision and fluency.
Targets
The third level of reporting is at the assessment target level. An assessment target defines the grade-specific knowledge, skill, or ability that students should know or be able to demonstrate within a domain in either ELA or mathematics. The assessment target reports provide additional information about groups of students at the more granular target level.
Example of a Mathematics Assessment Target
Grade 5—Concepts and Procedures Claim 1 Assessment Target D:
Understand the place value system
What do the Assessment Target Reports indicate?
For ELA, the assessment target reports are produced for each of claims 1 through 4:
- Claim 1—Reading
- Claim 2—Writing
- Claim 3—Listening
- Claim 4—Research/Inquiry
For mathematics, the assessment target reports are produced for Claim 1 only.
For mathematics claims 2, 3, and 4, items are intended to emphasize the mathematical practices; therefore, items may align to the content included in several mathematics assessment targets. The best common descriptors of the items included in these claims are the claim labels themselves.
Unlike the overall ELA or mathematics score, the assessment target reports do not address absolute performance. Rather, the reports provide two relative indicators of performance.
Relative Indicator 1: Performance Relative to the Entire Test
Relative indicator 1, performance relative to the entire test, indicates strengths and weaknesses relative to the test performance as a whole. Unlike achievement levels provided at the content area level, these strengths and weaknesses do not imply proficiency or that a particular content standard has been met. This indicator shows how a group of students performed on a target compared to the group’s overall performance on the assessment.
For example, a group of students may have performed extremely well in ELA overall, but their performance in some of the target areas may be relatively lower than the overall performance. Thus, the [down-arrow] icon [⌄] for a target does not imply a lack of proficiency. Instead, it simply communicates that these students’ performance on that target was statistically lower than their performance on the test as a whole. Although the students performed well on the test as a whole, an educator may want to focus instruction on lower-performance areas, particularly if other sources of evidence support that decision.
Table 2 displays the description of the assessment target icons for this indicator.
| Icon | Target Level | Description |
|---|---|---|
|
|
Better than performance on the test as a whole |
This target is relative strength. The group of students performed better on items from this target than they did on the rest of the test as a whole. |
|
|
Similar to performance on the test as a whole |
This target is neither a relative strength nor a relative weakness. The group of students performed about as well on items from this target as they did on the rest of the test as a whole. |
|
|
Worse than performance on the test as a whole |
This target is a relative weakness. The group of students did not perform as well on items from this target as they did on the rest of the test as a whole. |
|
|
Insufficient data |
Not enough information is available to determine whether this target is relative strength or weakness. |


Relative Indicator 2: Performance Relative to Met Standard (Level 3)
Relative indicator 2, performance relative to Met Standard, is an indicator of whether students’ performance on a target was above, near, or below Met Standard (Level 3).
A “Below” indicator suggests that students have not yet mastered the content assessed in a target; however, the students’ overall performance on the test may be near or above standard.
Table 3 displays the description of each of the assessment target icons for this indicator.
Table 3. Assessment Target Icons for Performance Relative to the Met Standard Indicator
| Icon | Target Level | Description |
|---|---|---|
|
|
Performed above Met Standard (Level 3) |
Student group performance was above Met Standard (Level 3) for this target. |
|
|
Performed near Met Standard (Level 3) |
Student group performance was near Met Standard (Level 3) for this target. |
|
|
Performed below Met Standard (Level 3) |
Student group performance was below Met Standard (Level 3) for this target. |
|
|
Insufficient data |
Not enough information is available to determine student group performance for this target. |


How Are the Assessment Target Reports Accessed?
Assessment target reports are available in CERS for groups of 30 or more students for targets with more than 10 items in the item pool. The How to View Summative Assessment Target Group Reports quick reference guide provides instructions to access the reports.
What Considerations and Cautions Are Applied When Using the Assessment Target Reports?
The following are key considerations and important cautions to keep in mind when using the assessment target reports:
- Assessment target reports are not available for the 2019–20, 2020–21, and the 2021–22 test administrations.
- CERS is updated about fourteen times per year. The data for the current year may change as a result of updated scoring and data are processed.
- For assessment of target performance, relative strengths and weaknesses at each target are reported for aggregate-level reports only (e.g., roster, grade level, school, or local educational agency) for student groups of 30 or more students.
- Assessment target score reports should serve as a starting point in an overall investigation of students’ strengths and weaknesses and constitute only one of many sources of evidence that should be used in evaluating student performance. ELA and mathematics targets with fewer than 11 contributing items to the assessment target are being suppressed in this report and will not be viewable in CERS.
- In keeping with the test blueprint, individual students may respond to only a few items within a target or no items at all. Therefore, targets that have too few items or too few students responding to items aligned to those targets are suppressed in the assessment target report. Further, educators should not assume individual student needs based on the apparent needs of groups of students. It is critical that educators use multiple pieces of information before determining the needs of individual students.
- Because the relative strengths and weaknesses at each target are computed within a group with a particular overall total performance, comparing target performance across groups may not be appropriate, as different groups will yield different overall performances.
- Assessment results are only one indicator of the student's performance and should be used along with other information, such as classwork and other assessment results, when making educational decisions.