Assessment Target Reports Frequently Asked Questions
1. How Are Smarter Balanced Scores Reported?
Smarter Balanced uses an evidence-centered design to develop assessment items aligned with the Common Core State Standards (CCSS) for English language arts/literacy (ELA) and Mathematics. That design results in a hierarchical scoring and reporting system that includes an overall scale score and achievement level, claim performance levels, and target reports. If the overall scale score and achievement level is the broadest measure of student achievement, the assessment target report represents a more detailed, or granular, level of summative assessment data available to educators. This is presented graphically in figure 1.
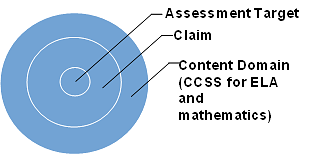
Figure 1. Hierarchical Scoring and Reporting System Design
2. What Is the Hierarchy of Scores and Reporting?
To maximize the use of assessment results, it is important to understand the Smarter Balanced hierarchical scoring and reporting system. Using these reports together will help inform instruction.
Scale Score and Achievement Level
For the first level in the hierarchy, each student receives a total score, expressed as a four-digit overall scale score and one of four achievement levels for each content area. The possible achievement levels are Standard Exceeded (Level 4), Standard Met (Level 3), Standard Nearly Met (Level 2), and Standard Not Met (Level 1).
Claims
For the second level in the hierarchy, the student’s performance on each claim is represented by one of three performance levels—Below Standard, Near Standard, or Above Standard. A claim is a statement about what a student knows or is able to do. Smarter Balanced has identified four claims specific to ELA and four claims for mathematics that focus on what students are expected to know and be able to do at each grade level. Claims can include more than one target. All claims and targets—as well as assessment blueprints and other test development resources—can be found in the Smarter Content Explorer.
Example of a Mathematics Claim
Concepts and Procedures Claim #1:
Students can explain and apply mathematical concepts and carry out mathematical procedures with precision and fluency.
Targets
The third level of reporting is at the assessment target level. An assessment target defines the grade-specific knowledge, skill, or ability that students should know or be able to demonstrate within a domain in either ELA or mathematics. The assessment target reports provide additional information about groups of students at the more granular target level.
Example of a Mathematics Assessment Target
Grade 5—Concepts and Procedures Claim 1 Assessment Target D:
Understand the place value system
3. What do the Assessment Target Reports indicate?
For ELA, the assessment target reports are produced for each of claims 1 through 4:
- Claim 1—Reading
- Claim 2—Writing
- Claim 3—Listening
- Claim 4—Research/Inquiry
For mathematics, the assessment target reports are produced for Claim 1 only.
For mathematics claims 2, 3, and 4, items are intended to emphasize the mathematical practices; therefore, items may align to the content included in several mathematics assessment targets. The best common descriptors of the items included in these claims are the claim labels themselves.
Unlike the overall ELA or mathematics score, the assessment target reports do not address absolute performance. Rather, the reports provide two relative indicators of performance.
Relative Indicator 1: Performance Relative to the Entire Test
Relative indicator 1, performance relative to the entire test, indicates strengths and weaknesses relative to the test performance as a whole. Unlike achievement levels provided at the content area level, these strengths and weaknesses do not imply proficiency or that a particular content standard has been met. This indicator shows how a group of students performed on a target compared to the group’s overall performance on the assessment.
For example, a group of students may have performed extremely well in ELA overall, but their performance in some of the target areas may be relatively lower than the overall performance. Thus, the [down-arrow] icon [ ] for a target does not imply a lack of proficiency. Instead, it simply communicates that these students’ performance on that target was statistically lower than their performance on the test as a whole. Although the students performed well on the test as a whole, an educator may want to focus instruction on lower-performance areas, particularly if other sources of evidence support that decision.
Table 1 displays the description of the assessment target icons for this indicator.
| Icon | Target Level | Description |
|---|---|---|
 |
Better than performance on the test as a whole | This target is relative strength. The group of students performed better on items from this target than they did on the rest of the test as a whole. |
 |
Similar to performance on the test as a whole | This target is neither a relative strength nor a relative weakness. The group of students performed about as well on items from this target as they did on the rest of the test as a whole. |
 |
Worse than performance on the test as a whole | This target is a relative weakness. The group of students did not perform as well on items from this target as they did on the rest of the test as a whole. |
 |
Insufficient data | Not enough information is available to determine whether this target is relative strength or weakness. |
Relative Indicator 2: Performance Relative to Met Standard (Level 3)
Relative indicator 2, performance relative to Met Standard, is an indicator of whether students’ performance on a target was above, near, or below Met Standard (Level 3).
A “Below” indicator suggests that students have not yet mastered the content assessed in a target; however, the students’ overall performance on the test may be near or above standard.
Table 2 displays the description of each of the assessment target icons for this indicator.
| Icon | Target Level | Description |
|---|---|---|
 |
Performed above Met Standard (Level 3) | Student group performance was above Met Standard (Level 3) for this target. |
 |
Performed near Met Standard (Level 3) | Student group performance was near Met Standard (Level 3) for this target. |
 |
Performed below Met Standard (Level 3) | Student group performance was below Met Standard (Level 3) for this target. |
 |
Insufficient data | Not enough information is available to determine student group performance for this target. |
4. How Are the Assessment Target Reports Accessed?
Assessment target reports are available in the California Educator Reporting System (CERS) for groups of 30 or more students for targets with more than 10 items in the item pool. The How to View Summative Assessment Target Group Reports quick reference guide provides instructions to access the reports.
5. What Considerations and Cautions Are Applied When Using the Assessment Target Reports?
The following are key considerations and important cautions to keep in mind when using the assessment target reports:
- Assessment target reports are not available for the 2019–20, 2020–21, and the 2021–22 test administrations.
- CERS is updated about fourteen times per year. This includes application updates twice per quarter, which then releases data for Interims and Summatives. The data for the current administration in this system may change as a result of updated scoring, relevant appeals, and resources that are processed.
- For assessment of target performance, relative strengths and weaknesses at each target are reported for aggregate-level reports only (e.g., roster, grade level, school, or local educational agency) for student groups of 30 or more students.
- Assessment target score reports should serve as a starting point in an overall investigation of students’ strengths and weaknesses and constitute only one of many sources of evidence that should be used in evaluating student performance. ELA and mathematics targets with fewer than 11 contributing items to the assessment target are being suppressed in this report and will not be viewable in CERS.
- In keeping with the test blueprint, individual students may respond to only a few items within a target or no items at all. Therefore, targets that have too few items or too few students responding to items aligned to those targets are suppressed in the assessment target report. Further, educators should not assume individual student needs on the basis of the apparent needs of groups of students. It is critical that educators use multiple pieces of information before determining the needs of individual students.
- Because the relative strengths and weaknesses at each target are computed within a group with a particular overall total performance, comparing target performance across groups may not be appropriate, as different groups will yield different overall performances.
- Assessment results are only one indicator of the student's performance and should be used along with other information, such as classwork and other assessment results, when making educational decisions.
Lexile® and Quantile®Measures
Lexile® and Quantile® measures and ranges are derived from student scores on the Smarter Balanced ELA and mathematics assessments. CERS contains Lexile measures and ranges for Smarter Balanced ELA summative assessments and ICAs. Quantile measures and ranges are available for Smarter Balanced math summative assessments and ICAs.
Lexile Measures for ELA Summative Assessments
Lexile Measures in Group View
Any group view will provide access to individual student Lexile results by selecting a student’s name and selecting [Student’s Test History] from the context menu. After selecting a summative ELA assessment, the toggle buttons will include an option to select Lexile results. Refer to the View Student Assessment Results by School and Grade section or the View Student Group Assessment Results section for details.
Once a user selects an ELA summative assessment to display in the group view, the Results page displays the [Results by Student] view by default. Selecting [Lexile Report] from the Select a results view drop-down (figure 2) will display the Lexile Report page (figure 3).
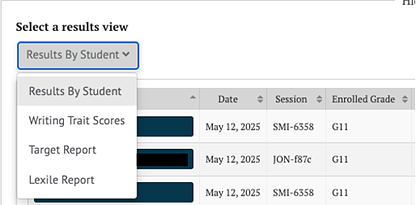
Figure 2. Select a Results View for Lexile Report
When the Select a results view drop-down is selected, as shown in figure 3, Lexile Report appears.
The options for each view are:
- [Results by Student] (default view)
- [Writing Trait Scores] (for ELA only)
- [Target Report] (for summative assessments only; student groups of 30 or more)
- [Lexile Report] (for ELA only)
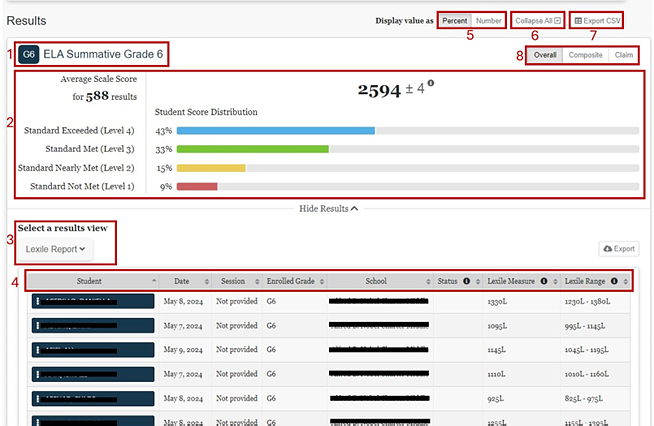
Figure 3. Lexile Results Page
The Lexile Results page for a Smarter Balanced ELA Summative displays the following information and elements:
- The name and grade of the assessment
- The Group Aggregate Panel displays aggregate data for the selected group of students
- The Select a results view drop-down menu offers the following options for display results:
- [Results by Student] (default view)
- [Writing Trait Scores] (for ELA only)
- [Target Report] (for summative assessments only; student groups of 30 or more)
- [Lexile Report] (For ELA Only)
- The Results View table
- The Display value as field contains a toggle allowing a user to change the display to show the student score distribution in percentages of students or numbers of students in each reporting category.
- The [Collapse All] button, which hides the Results View table for all the displayed assessments and toggles to an [Expand All] button, which displays the results again
- The [Export CSV] button, which gives the option to download the results in CSV format
- Toggle buttons to switch between performance scores: [Overall] and [Claim]
- The [Overall] toggle displays the Student Score Distribution with four achievement levels.
- The [Claim] toggle displays four claims with three reporting categories.
Lexile Measure and Range
When the [Lexile Report] is selected, the Results page displays the following information and elements (figure 4).
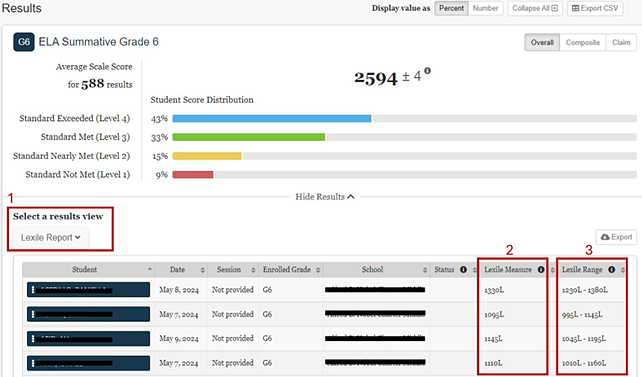
Figure 4. Lexile Measure and Lexile Range
- The Select a results view drop-down menu offers the following options for display results:
- [Results By Student] (default view)
- [Writing Trait Scores] (for ELA only)
- [Target Report] (for summative assessments only; student groups of 30 or more)
- [Lexile Report] (for ELA only)
- Lexile Measure: A student’s Lexile measure represents the student’s ability to read independently on a scale from below 0L to above 1600L.
- Lexile Range. A student’s Lexile range is 50L above and 100L below the student’s Lexile measure.
Lexile Measures By Student
Individual student Lexile results can be accessed from any group view by selecting a student’s name and selecting [Student’s Test History] from the context menu. After selecting a summative ELA assessment, the toggle buttons will include an option to select Lexile results. Refer to the View Student Assessment Results by School and Grade section or the View Student Group Assessment Results section for details.
Refer to the View Individual Student Results section for more information.
From the Student Test History Page, identify an summative assessment for ELA and select the test results card. Refer to Student Results Card and Table section for more information.
When the [Lexile] toggle is selected, a table with the student’s Lexile measures on the selected assessment is displayed (figure 5).
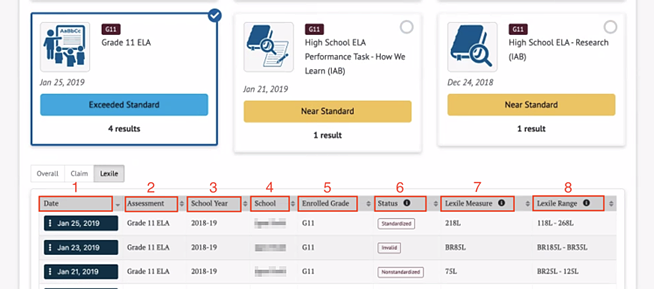
Figure 5. Lexile Measures Table
The Lexile table includes the following information for each student:
- Date: Date student completed the assessment
- Assessment: Name of Assessment
- School Year: School year for assessment
- School: Student’s assigned school at the time of the assessment
- Enrolled Grade: Student’s enrolled grade at the time of the assessment
- Status: For interim assessments, assessment status includes whether the Manner of Administration was Standardized or Non-standardized, or if the assessment was marked Partial or Complete (Completeness). For summative assessments, assessment status only includes whether the assessment administration (Manner of Administration) was Valid or Invalid. An empty field for a summative assessment indicates a valid assessment status.
- Lexile Measure: A student’s Lexile measure represents the student’s ability to read independently on a scale from below 0L to above 1600L.
- Lexile Range. A student’s Lexile range is 50L above and 100L below the student’s Lexile Measure.
Quantile Measures for Math Summative Assessments
Quantile Measures in Group View
Any group view will provide access to individual student Quantile results by selecting a student’s name and selecting [Student’s Test History] from the context menu. After selecting a summative math assessment, the toggle buttons will include an option to select Quantile results. Refer to the View Student Assessment Results by School and Grade section or the View Student Group Assessment Results section for details.
Once a user selects a Math summative assessment to display in the group view, the Results page displays the [Results by Student] view by default. Selecting [Quantile Report] from the Select a results view drop-down (figure 6) will display the Quantile Report page (figure 7).
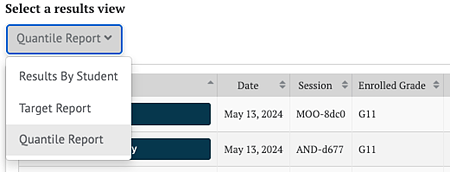
Figure 6. Select a Results View for Quantile Report
The options for each view are:
- [Results by Student] (default view)
- [Target Report] (for summative assessments only; student groups of 30 or more)
- [Quantile Report] (for math only)
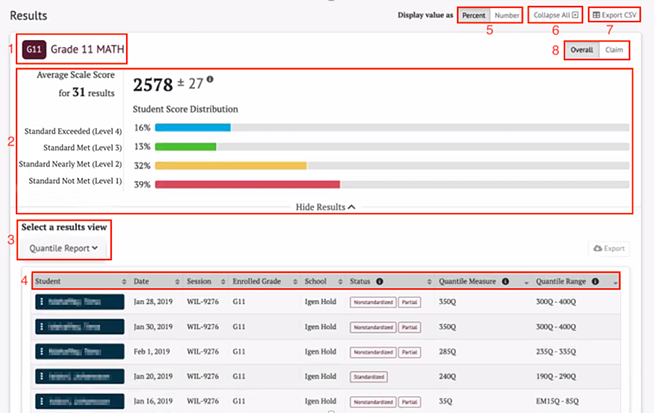
Figure 7. Quantile Report Display
The Results page for a Math Summative displays the following information and elements:
- The name and grade of the assessment
- The Group Aggregate Panel displays aggregate data for the selected group of students
- The Select a results view drop-down menu offers the following options for display results:
- [Results by Student] (default view)
- [Target Report] (for summative assessments only; student groups of 30 or more)
- [Quantile Report] (for math only)
- The Results View table
- The Display value as field contains a toggle allowing a user to change the display to show the student score distribution in percentages of students or numbers of students in each reporting category.
- The [Collapse All] button, which hides the Results View table for all the displayed assessments and toggles to an [Expand All] button, which displays the results again
- The [Export CSV] button, which gives the option to download the results in CSV format
- Toggle buttons to switch between performance scores: [Overall] and [Claim]
- The [Overall] toggle displays the Student Score Distribution with four achievement levels.
- The [Claim] toggle displays four claims with three reporting categories.
Quantile Measure and Range
When the [Quantile Report] is selected, the Results page displays the following information and elements (figure 8).
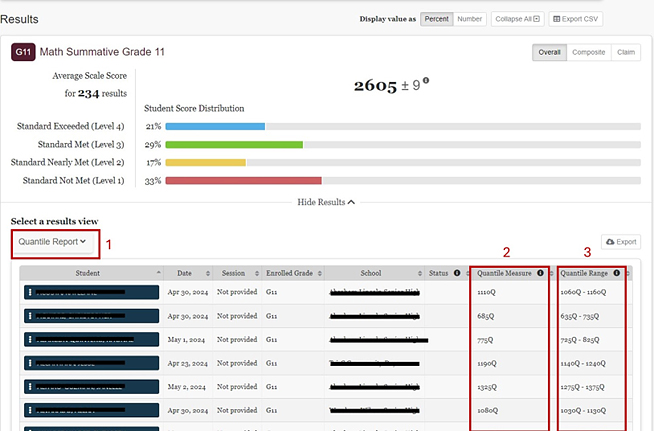
Figure 8. Quantile Measure Range View
- The Select a results view drop-down menu offers the following options for display results:
- [Results By Student] (default view)
- [Target Report] (for summative assessments only; student groups of 30 or more)
- [Quantile Report] (for math only)
- Quantile Measure: A student’s Quantile Measure represents the student’s readiness for mathematics instruction on a scale from below 0Q to above 1600Q.
- Quantile Range. A student’s Quantile Range is 50Q above and 50Q below the student’s Quantile Measure.
Quantile Measures By Student
Individual student Quantile results can be accessed from any group view by selecting a student’s name and selecting [Student’s Test History] from the context menu. After selecting summative math assessment, the toggle buttons will include an option to select Quantile results. Refer to the View Student Assessment Results by School and Grade section or the View Student Group Assessment Results for more information.
From the Student Test History Page, identify a summative assessment for math and select the test results card. Refer to Student Results Card and Table section for more information.
When the [Quantile] toggle is selected, a table with the student’s Quantile measures on the selected assessment is displayed (figure 9).
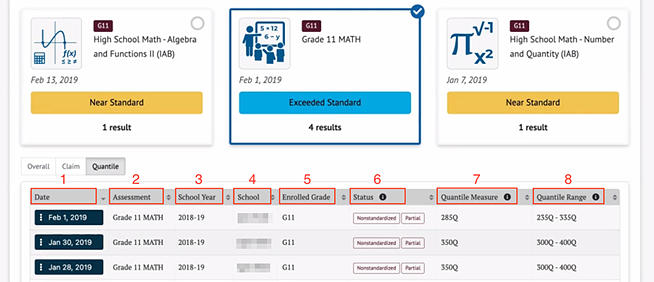
Figure 9. Quantile Measures Table
The Quantile table includes the following information for each student:
- Date: Date student completed the assessment
- Assessment: Name of Assessment
- School Year: School year for assessment
- School: Student’s assigned school at the time of the assessment
- Enrolled Grade: Student’s enrolled grade at the time of the assessment
- Status: For interim assessments, assessment status includes whether the assessment administration (Manner of Administration) was Standardized or Non-standardized, or if the assessment was marked Partial or Complete (Completeness). For summative assessments, assessment status only includes whether the assessment administration (Manner of Administration) was Valid or Invalid. An empty field for a summative assessment indicates a valid assessment status.
- Quantile Measure: A student’s Quantile measure represents the student’s readiness for mathematics instruction on a scale from below 0Q to above 1600Q.
- Quantile Range. A student’s Quantile range is 50Q above and 50Q below the student’s Quantile measure.