Summative Assessments and Interim Comprehensive Assessments
A scale score and an achievement level are provided for each student for the Smarter Balanced Summative Assessments and Interim Comprehensive Assessments (ICAs). These results describe how student performance relates to the academic standards measured by the assessment and provide an overall indication of student achievement in English language arts/literacy (ELA) and mathematics.
On the basis of students’ individual scale scores and the associated error band, student results for the summative assessments are reported in one of four overall achievement levels:
- Level 1—Minimal: The student demonstrates minimal grade-level knowledge and skills and shows a minimal understanding of and ability to apply the knowledge and skills needed for success in future coursework.
- Level 2—Developing: The student demonstrates developing grade-level knowledge and skills and shows an initial understanding of and ability to apply the knowledge and skills needed for success in future coursework.
- Level 3—Proficient: The student demonstrates proficient grade-level knowledge and skills and shows a thorough understanding of and ability to apply the knowledge and skills needed for success in future coursework.
- Level 4—Advanced: The student demonstrates advanced grade-level knowledge and skills and shows a sophisticated understanding of and ability to apply the knowledge and skills needed for success in future coursework.
Student results for the ICAs are reported in one of four overall achievement levels:
- Level 1—Below Standard: The assessment results indicate that the student has not yet demonstrated sufficient understanding of the knowledge and skills measured by the assessment.
- Level 2—Near Standard: The assessment results indicate that the student has partially met the grade-level standard and demonstrates some understanding of the knowledge and skills measured by the assessment.
- Level 3—Met Standard: The assessment results indicate that the student has met the grade-level standard and demonstrates adequate understanding and application of the knowledge and skills measured by the assessment.
- Level 4—Exceeded Standard: The assessment results indicate that the student has exceeded the grade-level standard and demonstrates advanced understanding and application of the knowledge and skills measured by the assessment.
These achievement levels were established through a formal achievement level–setting process that involved committees of member-state representatives, educators, parents/guardians, and other interest holders. Educators with expertise in working with English learners and students with disabilities participated to help ensure that the achievement levels are fair and appropriate for all students. The achievement levels represent increasing degrees of mastery of the knowledge and skills students are expected to demonstrate to be on track for college and career readiness.
In addition to overall achievement levels, composite and claim-level results are reported using three performance categories: Above Proficient, At or Near Proficient, and Below Proficient. These categories provide educators with additional context about student performance relative to the expectations for the assessed content.
Smarter Balanced members voted to approve the initial college- and career-readiness achievement levels for ELA and mathematics in November 2014. Members later approved cut scores for grades nine and ten in February 2019. These cut scores may be used for summative assessments administered in grades nine and ten and for the high school ICAs administered in grades nine and ten as part of an early detection system for college readiness. Beginning in the 2019–20 school year, grade nine and grade ten ICAs in ELA and mathematics were made available.
Table 1 and table 2 summarize the types of score information available on student and group reports for the Smarter Balanced Summative Assessments and ICAs, depending on the blueprint used.
Table 1 describes the information reported for assessments administered using the full blueprint. In ELA, four claim-level results are reported for the summative assessments and ICAs using the full blueprint. In mathematics, three claim-level results are reported because Claims 2 and 4 are combined.
| Types of Information | Individual Student Report | Group Report |
|---|---|---|
|
Overall Score and Achievement Level |
Reported |
Reported |
|
Claim Results |
Reported |
Reported |
|
Target Reports (30 or more students) |
N/A |
Reported |
|
Lexile/Quantile Scores |
Reported |
Reported |
Note that in table 2, composite claim results are reported for summative assessments using the adjusted blueprint. Smarter Balanced conducted analyses that indicate that the full and adjusted blueprints evaluate the same depth of content, keep the same blueprint proportions, and largely use the same distribution of computer adaptive test items and performance tasks.
| Types of Information | Individual Student Report | Group Report |
|---|---|---|
|
Overall Score and Achievement Level |
Reported |
Reported |
|
Composite Claim Results |
Reported |
Reported |
|
Target Reports (30 or more students) |
N/A |
Reported |
|
Lexile/Quantile Scores |
Reported |
Reported |
Table 3 and table 4 show the range of scale scores for each achievement level in the summative assessment and ICA in ELA and mathematics.
| Grade Level | Level 1 | Level 2 | Level 3 | Level 4 |
|---|---|---|---|---|
|
3 |
<2367 |
2367–2431 |
2432–2489 |
>2489 |
|
4 |
<2416 |
2416–2472 |
2473–2532 |
>2532 |
|
5 |
<2442 |
2442–2501 |
2502–2581 |
>2581 |
|
6 |
<2457 |
2457–2530 |
2531–2617 |
>2617 |
|
7 |
<2479 |
2479–2551 |
2552–2648 |
>2648 |
|
8 |
<2487 |
2487–2566 |
2567–2667 |
>2667 |
|
9 |
<2489 |
2489–2570 |
2571–2671 |
>2671 |
|
10 |
<2491 |
2491–2576 |
2577–2677 |
>2677 |
|
11 |
<2493 |
2493–2582 |
2583–2681 |
>2681 |
| Grade Level | Level 1 | Level 2 | Level 3 | Level 4 |
|---|---|---|---|---|
|
3 |
<2381 |
2381–2435 |
2436–2500 |
>2500 |
|
4 |
<2411 |
2411–2484 |
2485–2548 |
>2548 |
|
5 |
<2455 |
2455–2527 |
2528–2578 |
>2578 |
|
6 |
<2473 |
2473–2551 |
2552–2609 |
>2609 |
|
7 |
<2484 |
2484–2566 |
2567–2634 |
>2634 |
|
8 |
<2504 |
2504–2585 |
2586–2652 |
>2652 |
|
9 |
<2517 |
2517–2600 |
2601–2675 |
>2675 |
|
10 |
<2533 |
2533–2613 |
2614–2696 |
>2696 |
|
11 |
<2543 |
2543–2627 |
2628–2717 |
>2717 |
Claim Results
A claim is a summary statement about the knowledge and skills students will be expected to demonstrate on the assessment related to an aspect of the Common Core State Standards. The ELA claims are Reading, Writing, Listening, and Research. The mathematics claims are Concepts and Procedures, Problem Solving, Communicating Reasoning, and Modeling and Data Analysis. For more information on Smarter Balanced claims, targets, and standards information, please check out the Smarter Content Explorer. Claim results are reported in one of three reporting categories: Above Proficient, At or Near Proficient, or Below Proficient. These reporting categories are determined using the same calculation in the summative and interim assessments.
California adopted the Smarter Balanced adjusted-form summative blueprint starting in the 2020–21 test administration and does not have access to individual student claim results. Individual student claim results cannot be reliably computed on the basis of the reduced number of items aligned to each claim on the adjusted-form blueprint. Group-level claim results may be computed for a large group of students (for example, students in a school or local educational agency [LEA]), but this data is not available in CERS at this time.
Target Reports (Summative Only)
Each Smarter Balanced claim for ELA and mathematics is composed of a set of assessment targets (standards or partial standards that are assessed). Target reports provide more detail about the range of content and depth of knowledge levels. On the summative assessment, target-level scores are calculated for each ELA claim. For mathematics, target-level scores are calculated for Claim 1 only. CERS displays aggregate target-level reports for each summative assessment. Target scores are reported as Performance Relative to the Entire Test and Performance Relative to Level 3 (Proficient).
Target reports are available only for student groups of 30 or more, for targets with 10 or more items in the item pool. Target reports are unavailable for the school years 2019–20 through 2021–22.
Performance Relative to the Entire Test
Performance Relative to the Entire Test is reported in one of three reporting categories: Better, Similar, or Worse. This report indicates whether a group of students’ performance on a target was better than, the same as, or worse than the students’ performance on the entire assessment. A “Worse” indicator does not necessarily mean poor performance on a target but rather that students’ performance in this area was weaker relative to their overall performance.
Performance Relative to Level 3 (Proficient)
Performance Relative to Level 3 (Proficient) is reported in one of three reporting categories: Above, At or Near, or Below. A “Below” indicator suggests that students have not yet mastered the content assessed in a target. The sample target report (figure 1), shows the students’ average scale score and standard error of the mean. On Target 1, the students performed Below Proficient, which is similar to their overall results. This indicates a weakness for this assessed content and an opportunity to follow up the assessment with instructional support. On Target 4, students performed At or Near Proficient and performed similar on this target compared to how they did on the entire assessment.
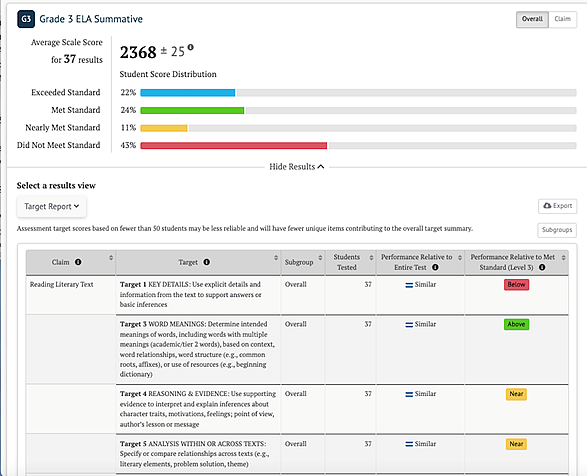
Figure 1. Sample Target Report for a Summative Assessment
Lexile and Quantile Scores
Lexile® and Quantile® measures provide additional information to help educators, families, and students understand a student’s readiness in ELA and mathematics. These measures do not replace the overall summative assessment data but offer another lens to support instruction, intervention, and goal setting.
What is a Lexile® Measure? A Lexile measure describes a student’s reading ability. Connecting students with books in their Lexile range 100L below to 50L above their reported Lexile measure provides an ideal level of reading challenge. Reading abilities are improved more quickly when students read materials within their Lexile range. A student’s Lexile range, in combination with classroom data, can be used to find a text of appropriate difficulty. To find books within a student’s Lexile range, monitor a student’s progress toward college and career readiness, or access additional Lexile tools and resources, visit the Lexile & Quantile Hub. For more information and resources surrounding the Lexile and Quantile measures, visit the Lexile® and Quantile® Measures web page on the CAASPP & ELPAC Website.
What is a Quantile® Measure? A Quantile measure describes a student’s mathematics ability. Connecting students with mathematics materials in the Quantile range 50Q below and 50Q above their reported Quantile measure provides an ideal level of mathematics challenge. Quantile measures can be used to match a student to mathematics materials for practice at home. A student’s Quantile range, in combination with classroom data, can be used to target appropriate skills and concepts for mathematics instruction. To help strengthen a student’s mathematical skills and progress toward college and career readiness, visit the Lexile & Quantile Hub. For more information and resources surrounding the Lexile and Quantile measures, visit the Lexile® and Quantile® Measures web page on the CAASPP & ELPAC Website.