Interim Assessment Blocks
Student results for Smarter Balanced Interim Assessment Blocks (IABs) and Focused IABs (FIABs) for English language arts/literacy (ELA) and mathematics are reported as one of three reporting categories that represents a range of scale scores: Above Standard, Near Standard, or Below Standard. For group-level reporting, a student score distribution by reporting category is also provided, which indicates the proportion of students that performed within each reporting category.
IAB or FIAB reporting categories—Above Standard, Near Standard, and Below Standard—differ from achievement levels (Level 4 [Advanced], Level 3 [Proficient], Level 2 [Developing], Level 1 [Minimal]), which are used to communicate overall performance on the Smarter Balanced Interim Comprehensive Assessments (ICAs) and Smarter Balanced Summative Assessments for ELA and mathematics.
A direct comparison cannot be made between IAB and FIAB reporting categories and achievement levels on the ICAs and summative assessments because IAB and FIAB reporting categories are derived differently than the ICA and summative assessment achievement levels. ICA and summative assessment achievement levels represent a range of scale scores and are explained in more detail in the Summative Assessments and Interim Comprehensive Assessments section.
Note that student scores on California Science Test (CAST) Interim Assessments are reported with achievement levels, and student scores on the ELPAC Interim Assessments are reported with performance levels, both of which are different from IAB and FIAB reporting categories. The overall performance on the CAST and ELPAC Interim Assessments is explained in more detail in the Reporting Overall Performance on CAST Interim Assessments section and Reporting Overall Performance on ELPAC Interim Assessments section.
IAB and FIAB reporting categories are calculated using the grade-level performance standard, which is defined as the summative (and ICA) cut score between levels 2 and 3 for each tested grade level. Student performance on an IAB or FIAB is evaluated against the grade-level performance standard (for example, a student’s scale score for the Grade Three Numbers and Operations—Fractions IAB is compared to the Grade three mathematics summative assessment performance standard). To access these grade-level scores, refer to table 3 and table 4 in the Summative Assessments and Interim Comprehensive Assessments section. A calculation using the grade-level performance standard and the student’s standard error of measurement (SEM) determines the range for the middle IAB or FIAB reporting category, Near Standard.
The SEM represents the range in which a student’s score is likely to be if that student were to take the assessment multiple times, or if the student were to take an assessment of parallel construction and similar difficulty, without receiving further instruction. In other words, the SEM represents the uncertainty around a student’s scale score. The SEM is multiplied by 1.5 to create a confidence interval that likely includes the student’s true score. The confidence interval is even larger than the student’s SEM, so it provides greater certainty, or confidence, in the reporting category classification. IAB and FIAB scale scores are derived using fewer items than the overall vertical scale scores on the ICAs and summative assessments. Therefore, the SEM for an IAB or FIAB scale score will be greater than that of the overall vertical scale score of the ICAs or summative assessments.
Figure 1 contains a dot representing the scale score for each of seven students being evaluated on a grade four mathematics IAB. The bars above and below the scale score are the confidence interval, or 1.5 times the SEM on the assessment. The dark horizontal line is the performance standard for the grade four mathematics ICA and summative assessment—a scale score of 2485. If the confidence interval for the student’s scale score on the IAB is completely above the performance standard, as in students 1, 5, and 6, the student’s reporting category is Above Standard. If the confidence interval for the student’s scale score is completely below the performance standard, as in students 4 and 7, the student’s reporting category is Below Standard. If the confidence interval for the student’s scale score touches the performance standard, as in students 2 and 3, the student’s reporting category is Near Standard, regardless of whether the reported scale score (the dot) is above or below the performance standard.
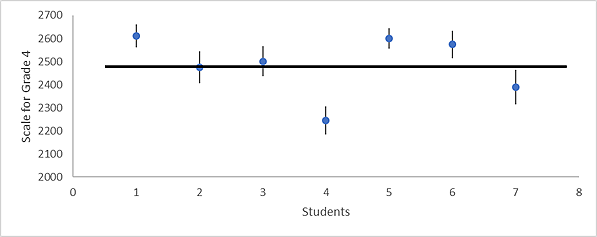
Figure 1. Examples of Student Confidence Intervals and the Performance Standard for a Grade Four Mathematics IAB
Please note that the scale score of some students in the Near Standard category will be either above or below the performance standard but not far enough above or below, such that the performance can be confidently labeled as Above Standard or Below Standard.
For full technical details on the calculations used, please refer to chapter 8 of the Smarter Balanced Scoring Specifications for Summative and Interim Assessments.