Interim Assessment Item-Level Information
Overview of Item-Level Results
Item-level information is available for interim assessments only. Table 1 presents an overview of item-level results in CERS by report type and interim assessment.
| Report Name | Report Description | Interim Assessment |
|---|---|---|
|
Results by Item Report |
The Results by Item Report is available to teachers and administrators when viewing group-level results for a specific interim assessment.
Users can access individual student responses to each item by selecting the item number in the table.
|
|
|
Key/Distractor Analysis Report |
The Key/Distractor Analysis Report is available to teachers and administrators when viewing group results for a specific interim assessment.
|
|
|
Writing Trait Score Report |
When the English language arts/literacy (ELA) performance task includes an extended-response item, item-level results are reported as the Writing Trait Score Report.
|
|
Smarter Balanced Interim Assessments
Claims, Targets, and Standards
Claims and targets are a way of classifying test content. The claim is the major topic area. For example, in English language arts/literacy, Reading is a claim. Within each claim, there are targets that describe the knowledge and skills that the test measures. Each target may encompass one or more standards from the California Common Core State Standards (CCSS). Within the Reading claim, for example, one of the targets is concerned with finding the central idea in a text. Domains are large groups of related standards in the mathematics CCSS (for example, Geometry, Statistics, and Probability, Ratios and Proportional Relationships). More information about the claims, targets, and standards can be found on the Development and Design web page of the Smarter Balanced website.
Depth of Knowledge
Depth of knowledge (DOK) levels, developed by Webb, reflect the complexity of the cognitive process demanded by curricular activities and assessment tasks (table 2). Higher DOK levels are associated with activities and tasks that have high cognitive demands. The DOK level describes the kind of thinking a task requires, not if the task is difficult in and of itself.
| DOK Level | Title of Level |
|---|---|
|
1 |
Recall |
|
2 |
Skills and Concepts |
|
3 |
Strategic Thinking |
|
4 |
Extended Thinking |
Item Difficulty
Each Smarter Balanced test item is assigned a difficulty level based on the proportion of students in the field test sample who responded to that item correctly. The students who responded to the item are referred to as the reference population. The reference population determines the difficulty level of a test item. (Note that the reference population for an item consists of all the students who took the assessment the year the item was field-tested. Depending on when the item was field-tested, the reference population may refer to students who took the spring 2014 field test or a subsequent summative assessment that included embedded field tested items.)
Test items are classified as easy, moderate, or difficult on the basis of the average proportion of correct responses of the reference population, also referred to as the average proportion-correct score (table 3). The average proportion-correct score (.-value) can range from 0.00 (no correct answers, meaning the item is difficult) to 1.00 (all correct answers, meaning the item is easy).
| Difficulty Category | Range of Average Proportion Correct (. -value) Score (Minimum–Maximum) |
|---|---|
|
Easy |
0.67–1.00 |
|
Moderate |
0.34–0.66 |
|
Difficult |
0.00–0.33 |
For items worth more than 1 point, the average proportion correct score is the item’s average score among students in the reference population divided by the maximum possible score on the item. For example, if the average score for a 2-point item is 1, its average proportion correct score is 1 divided by 2, or 0.50. In this example, that test item would be rated as moderate on the item difficulty scale.
Easy items are answered correctly by at least 67 percent of the students in the reference population.
Moderate items are answered correctly by 34 to 66 percent of the reference population.
Difficult items are answered correctly by 33 percent or fewer of the reference population.
CAST Interim Assessments
Domains and Standards for CAST Interim Assessments
The California Next Generation Science Standards (CA NGSS) are organized into three major categories, called science domains, representing Earth and Space Sciences, Life Sciences, and Physical Sciences. Each domain includes a set of learning standards, called performance expectations (PEs), that describe what a student should know and be able to do. The CA NGSS includes a fourth subdomain titled Engineering, Technology, and the Applications of Science (ETS). The ETS subdomain has its own PEs as well. ETS PEs are assessed within the context of the three other science domains. PEs represent an integration of science content knowledge, applicable skills, and broad ideas applicable to all scientific disciplines. More information on the CA NGSS and its PEs can be found on the NGSS for California Public Schools, K-12 web page of the CDE website.
Depth of Knowledge
Depth of knowledge (DOK) levels, developed by Webb, reflect the complexity of the cognitive process demanded by curricular activities and assessment tasks. There are four DOK levels (table 4), ranging from level one, which involves the lowest cognitive demand and thought complexity, to level four, which involves the highest cognitive demand and thought complexity. The DOK level describes the kind of thinking a task requires and is not necessarily an indicator of difficulty.
| DOK Level | Title of Level |
|---|---|
|
1 |
Recall and Reproduction |
|
2 |
Working with Skills and Concepts |
|
3 |
Short-Term Strategic Thinking |
|
4 |
Extended Strategic Thinking |
Item Difficulty
Each California Science Test (CAST) Interim Assessment item is assigned a difficulty level based on the proportion of students in the field test sample who responded to that item correctly. The students who responded to the item are referred to as the reference population. The reference population determines the difficulty level of a test item.
Test items are classified as easy, moderate, or difficult on the basis of the average proportion of correct responses of the reference population, also referred to as the average proportion-correct score (table 5). The average proportion-correct score (.-value) can range from 0.00 (no correct answers, meaning the item is difficult) to 1.00 (all correct answers, meaning the item is easy).
| Difficulty Category | Range of Average Proportion Correct (.-value) Score (Minimum–Maximum) |
|---|---|
|
Easy |
0.67–1.00 |
|
Moderate |
0.34–0.66 |
|
Difficult |
0.00–0.33 |
ELPAC Interim Assessments
Domains and Task Types
The English Language Proficiency Assessments for California (ELPAC) Interim Assessments are designed to support teaching and learning throughout the academic year for English learner (EL) students. These assessments focus on four domains: Listening, Speaking, Reading, and Writing. Each domain assesses specific language skills, such as comprehension, verbal expression, reading proficiency, and writing abilities. The task types for each domain are aligned with the 2012 California English Language Development (ELD) Standards. The ELPAC Interim Assessments cover grade levels from kindergarten through grade twelve, providing valuable insights into students’ progress in acquiring English language proficiency (ELP).
Performance Level Descriptors
The performance level descriptors (PLDs) are based on the ELD Standards proficiency levels, which describe how EL students demonstrate use of language at different stages of development. The PLDs in table 6 indicate the skill degree and variation of the items ranging from Beginning to Develop to Well Developed. Because of the nature of language and the ELPAC task types, some items measure more than one PLD. Note the values in the PLD Key column are the list of values assigned to each item within the ELPAC Interim Assessment in the California Educator Reporting System (CERS), indicating the various combinations of PLDs assessed by the item. The information in the Description column describes the PLDs covered by that item.
| PLD Key | Description |
|---|---|
|
1 |
Targets the Beginning to Develop (PLD 1) skills in the assessed domain |
|
2 |
Targets the Somewhat Developed (PLD 2) skills in the assessed domain |
|
3 |
Targets the Moderately Developed (PLD 3) skills in the assessed domain |
|
4 |
Targets the Well Developed (PLD 4) skills in the assessed domain |
|
5 |
Targets the Beginning to Develop to Somewhat Developed (PLDs 1 and 2) skills in the assessed domain |
|
6 |
Targets the Beginning to Develop to Moderately Developed (PLDs 1 through 3) skills in the assessed domain |
|
7 |
Targets the Beginning to Develop to Well Developed (PLDs 1 through 4) skills in the assessed domain |
|
8 |
Targets the Somewhat Developed to Moderately Developed (PLDs 2 and 3) skills in the assessed domain |
|
9 |
Targets the Somewhat Developed to Well Developed (PLDs 2 through 4) skills in the assessed domain |
|
10 |
Targets the Moderately Developed to Well Developed (PLDs 3 and 4) skills in the assessed domain |
Item Difficulty
Item-level results provided in CERS contain information about a group’s performance and each student’s performance on each item on the ELPAC Interim Assessment. For each item, information is provided for the group being evaluated.
Test items are classified as easy, moderate, or difficult on the basis of the average proportion of correct responses of the reference population, also referred to as the average proportion-correct score. The average proportion-correct score (.-value) can range from 0.00 (no correct answers, meaning the item is difficult) to 1.00 (all correct answers, meaning the item is easy). These difficulty categories indicate how difficult an item is relative to the Summative ELPAC item pool for each grade level or grade span. For each domain, difficulty categories were created by ordering the items from easiest to most difficult in the item pool. All of the items were then assigned a difficulty category based on the descriptions shown in table 7.
| Difficulty Category | Description |
|---|---|
|
Easy |
These items have a .-value higher than 75 percent of items in the bank. |
|
Moderate |
These items have a .-value lower than the easy items and higher than the difficult items. |
|
Difficult |
These items have a .-value lower than 75 percent of items in the bank. |
Example of an Interim Assessment Implementation: End-of-Unit Assessment
In this section, an example of how an educator might use one of the IAs to improve teaching and learning in the classroom is provided. Included in this example are screen captures from the California Educator Reporting System (CERS) that illustrate the different views available to educators to analyze the data and interpret it within their local context. Results will be analyzed at the group level, individual student level, and item level. At each level, highlights of appropriate use and cautions will be provided.
Group-Level Analysis
As shown in figure 1, Ms. Garcia’s classes had an average scale score of 2409 on the Grade 3 ELA – Read Literary Texts Interim Assessment Block (IAB). She can also see the error band (standard error of the mean) of ± 15 points. This means that if an assessment of parallel design were given to these students on another day without further instruction, their average scale score would likely fall between 2394 (2409 minus 15 points) and 2424 (2409 plus 15 points).
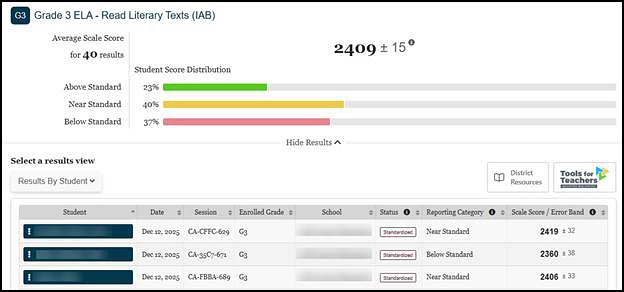
Figure 1. Group-Level View of IAB Results
Ms. Garcia can see from the Student Score Distribution section that 23 percent of her students scored within the Above Standard reporting category, 40 percent of the students scored within the Near Standard reporting category, and 37 percent scored within the Below Standard category.
From the group results page, Ms. Garcia can access links to supports through the [Tools for Teachers] button. The link leads to the Interim Connections Playlist (ICP) for that specific IAB—each IAB has an associated Tools for Teachers Connections Playlist. Connections Playlists are developed by teachers for teachers. Each playlist shows a Performance Progression that identifies the attributes of Below, Near, or Above performance and links to Tools for Teachers lessons that support the skills covered in the associated interim assessment. In addition to the Smarter Balanced Connections Playlists, local educational agencies (LEAs) and schools have the option to upload links to local LEA or school resources within CERS.
By selecting the [Tools for Teachers] button, Ms. Garcia can access resources for all reporting categories. Ms. Garcia can find
- instruction designed to enrich and expand student skills, and
- instruction based on student needs.
Refer to the Smarter Balanced Tools for Teachers subsection for more information.
Group Item-Level Analysis
For each item in the IAB, Ms. Garcia can see the claim, target, item difficulty, relevant standard assessed, and proportion of students who received full credit, as well as the proportion of students at each score point.
For example, as shown in figure 2, item 2 is noted as “Moderate.” Ms. Garcia sees that 65 percent of her students received full credit on item 2. Continuing in the same row, she can also see that 35 percent of her students did not receive any points and 65 percent received the maximum of one point. This information indicates a need for additional support.
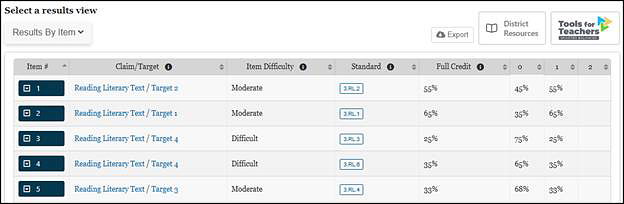
Figure 2. Item-Level View of IAB Results: Group Scores
Ms. Garcia can also sort the Full Credit column to quickly identify test items that students performed well on and items where students struggled.
Student-Level Analysis
To learn more about her students’ individual needs, Ms. Garcia can view Results by Student, as shown in figure 3. The Reporting Category column is sortable, so Ms. Garcia can easily identify the students who performed Above, Near, or Below Standard. She can use that information during small-group time in her classroom.
Using the test results for students, combined with her knowledge of student performance on classroom assignments, homework, and other observations, Ms. Garcia makes inferences about her students’ ability to read and comprehend literary text. She is confident that students who scored in the Above Standard category have mastered the skills and knowledge taught in the classroom and are in no need of additional support on that content. For those students, she uses an idea from the ICP to offer an extra challenge along with some additional independent reading time.
Next, Ms. Garcia considers how to support the students who scored in the Below Standard category, suspecting that they might need additional instruction. Ms. Garcia remembers that the IAB is only one measure, and it should always be used in combination with other information about her students. She knows that a student who has never had difficulty comprehending literary text may have been having a bad day when the interim assessment was administered. With that caveat in mind, Ms. Garcia reviews the reporting categories and chooses an instructional resource from the ICP to support the students who scored Below Standard in a collaborative learning group.
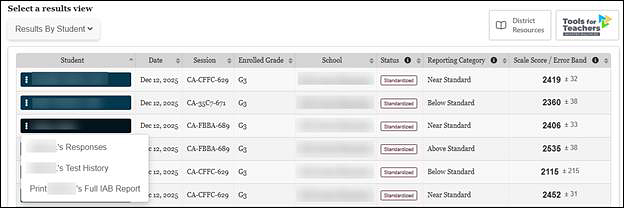
Figure 3. Results by Student View of IAB Results
As shown in figure 3, Ms. Garcia can select an individual student from the group list (by selecting the blue box with the student’s name) to examine the student’s performance on items within the IAB. When an individual student is selected, Ms. Garcia can select the option to view the student’s responses, and a screen showing each item in the IAB is displayed, as shown in figure 4.
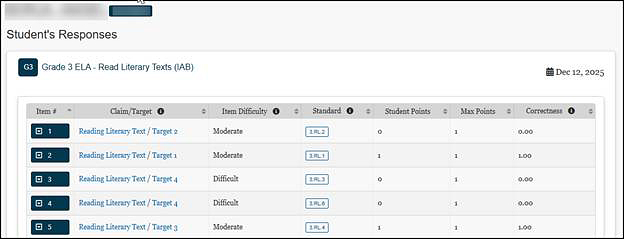
Figure 4. Individual Student Item-Level View of IAB Information
Ms. Garcia selects item 1, and the following three tabs appear [Item Viewer], [Rubric and Exemplar], and [Item Information], as shown in figure 5.
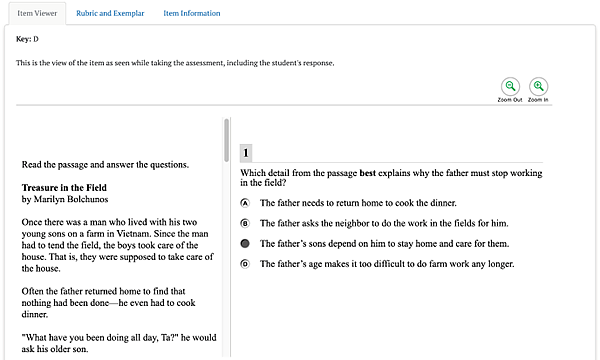
Figure 5. Item-Level Tabs
By examining student responses in the [Item Viewer] tab, Ms. Garcia can identify patterns in student responses that might reveal common misconceptions or misunderstandings. If several students chose the same incorrect response, for example, Ms. Garcia can isolate areas to revisit with her class.
As shown in figure 6, the [Rubric and Exemplar] tab shows the exemplar (that is, correct response), any other possible correct responses to the item, and a rubric that defines the point values associated with specific responses. For multiple-choice questions, the key or correct response is provided.
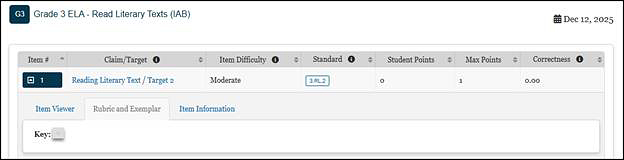
Figure 6. [Rubric and Exemplar] Tab
As shown in figure 7, the [Item Information] tab describes the claim, assessment target, and standard that the item assesses. This tab also provides the depth of knowledge, the item difficulty, and links to other supporting documentation.
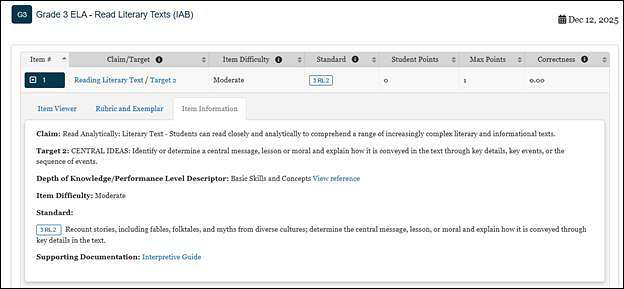
Figure 7. [Item Information] Tab
As shown in figure 7, item 1 is aligned to Standard 3.RL.2 and assesses Reading claim, Target 2. This information tells Ms. Garcia what concepts and skills the item assesses.
Ms. Garcia can also see from this tab that item 1 is classified as moderate. Ms. Garcia can include item difficulty in her inferences about student performance because item classification provides her with additional context when reviewing test results and considering instructional implications.
Student scores on more difficult items should be treated differently from the scores on less difficult items. For example, if half of the students get an item wrong, Ms. Garcia should avoid making generalized inferences about student needs. Instead, Ms. Garcia can account for the item difficulty when drawing conclusions from test results to determine what students know and can do. If the item is rated difficult, Ms. Garcia’s conclusions about her students may differ from conclusions based on an item rated easy. If half of the students answer an easy item incorrectly, she may decide to re-teach the concepts addressed in that item. On the other hand, if half of her students got a difficult item incorrect, she may choose to address that result by encouraging additional practice on this type of item.
Key and Distractor Analysis
For selected-response items, Ms. Garcia can see whether a large number of students selected a particular incorrect response, which may signal a common misconception. This report is available by selecting Key/Distractor Analysis from the drop-down list in the Select a results view, as shown in figure 8.
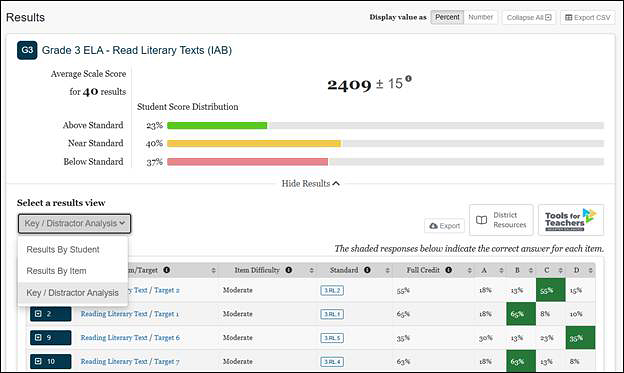
Figure 8. Select to View Key/Distractor Analysis
As shown in figure 9, the Key and Distractor Analysis view displays information for multiple-choice and multiselect items. Ms. Garcia can see the claim, target, item difficulty, and related standard(s) for each item; the percentage of students who earned full credit for each item; and the percentage of students who selected each answer option. (For multiselect items that have more than one correct answer, these percentages may not add up to 100 percent.) Ms. Garcia can sort the list by the percentage of students who earned full credit to easily identify those items on which students had the greatest difficulty and then determine whether there were incorrect answers that many students selected. (The correct answers are shaded.)
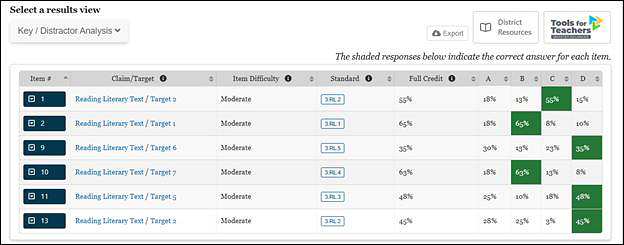
Figure 9. Key and Distractor Analysis View
Ms. Garcia identifies item 10 as one on which 18 percent of the students selected the same incorrect answer, A. To learn more about this item, the teacher can select the item number and see four tabs, [Student Points and Responses], [Item Viewer], [Rubric and Exemplar], and [Item information] as shown in figure 10. From the [Student Point and Responses] tab, the teacher can sort the Response column to see which students incorrectly selected option A. By selecting the [Item Viewer] tab, Ms. Garcia can see all the response options and, using other information about the students based on classroom discussion and assignments, begin to form hypotheses about why those students may have chosen the incorrect response option. She may decide to post that item and have the students discuss their reasoning aloud.
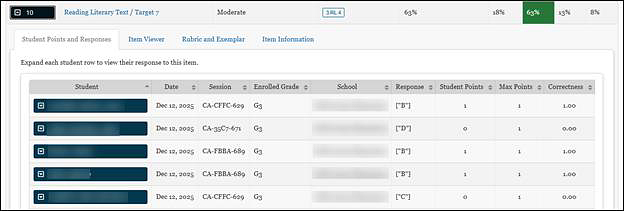
Figure 10. Key and Distractor Analysis Item Details Tabs
Writing Trait Score Report
Each performance task on the ELA Interim Comprehensive Assessment (ICA) and selected ELA IABs includes a full write, or essay question. For these assessments, a Writing Trait Score is provided, as shown in figure 11, that allows teachers to analyze the strengths and weaknesses of student writing based on student performance on the essay question.
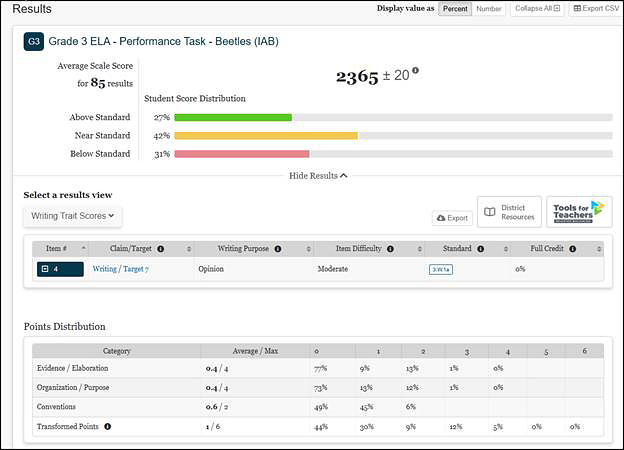
Figure 11. Group Report on the Essay Question
This performance task report provides the information found on other group summary reports (average scale score and error band, student score distribution and item information). In addition, it indicates the writing purpose of the essay question. The purpose may be argumentative, explanatory, informational, narrative, or opinion depending on the grade level of the assessment.
The report provides the average points earned by the group of students and maximum number of points for each writing trait.
The three writing traits in table 8 describe the following proficiencies in the writing process.
| Writing Trait Categories | Maximum Points |
|---|---|
|
Organization/Purpose: Organizing ideas consistent with purpose and audience |
4 points |
|
Evidence/Elaboration: Providing supporting evidence, details, and elaboration consistent with focus/thesis/claim, source text or texts, purpose, and audience |
4 points |
|
Conventions: Applying the conventions of standard written English; editing for grammar usage and mechanics to clarify the message |
2 points |
The report also displays the Transformed Points value that is calculated by adding the Conventions score to the average of the Organization/Purpose and Evidence/Elaboration scores.
- These two values represent two dimensions that are used to compute the student’s overall scale score and the Claim 2—Writing reporting category for the ELA ICAs.
A student’s writing score is computed as follows:
- Organization/Purpose: 4 points earned out of 4 possible points
- Evidence/Elaboration: 1 point earned out of 4 possible points
- Conventions: 2 points earned out of 2 possible points
- Average: (4+1)/2 = 2.5, which is rounded up to 3 points, 3 + 2 = 5 Transformed Points
The report also provides the percentage distribution of students by the number of points they earned for each writing trait and the percentage of students who earned each possible number of Transformed Points.
Training guides for hand scoring are available in the Interim Assessment Hand Scoring System. The guides include the rubrics and annotated scored student responses that are used to determine student scores.
The performance task writing rubrics are also available in the following links:
As shown in figure 12, Ms. Garcia can view the writing trait scores for individual students by selecting the blue box for item 4. This displays a report on individual student performance by writing trait and Transformed Points earned. Ms. Garcia can sort by Transformed Points to quickly identify students who performed well and those who need additional support. When the blue box with the student’s name is selected, the [Student Points and Responses] tab displays the student’s essay. The [Item Viewer] tab displays the essay question as it appeared on the assessment. The [Rubric and Exemplar] tab provides the writing rubrics, and the [Item Information] tab provides information about the claim, target, standard, item difficulty, and depth of knowledge.
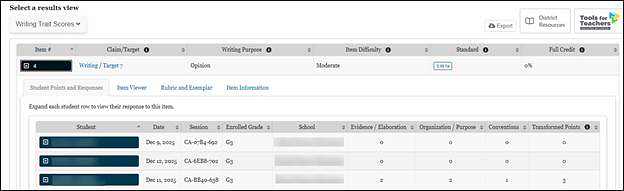
Figure 12. Individual Student Report on the Essay Question
As Ms. Garcia reviews these results, she considers all the same caveats about weighing student scores in the context of other evidence she has collected on her students, factoring in the difficulty of the test item and manner of test administration and recognizing that no assessment or single test question should be used as the sole indicator of student performance. Ms. Garcia considers the report and the rubric along with other writing assignments students have turned in that year. She plans additional support for writing in class and shares practice ideas with her students and their families as well.
Additional Item-Level Features of the Interim Assessment Blocks
Interim assessment results used in conjunction with familiarity and knowledge of the ELA and mathematics academic content standards help Ms. Garcia to interpret and understand what content was measured, and where additional support and resources may be needed to address learning gaps. For example, refer the Content Explorer, which elaborates on Standard 3.RL.2 in figure 13.
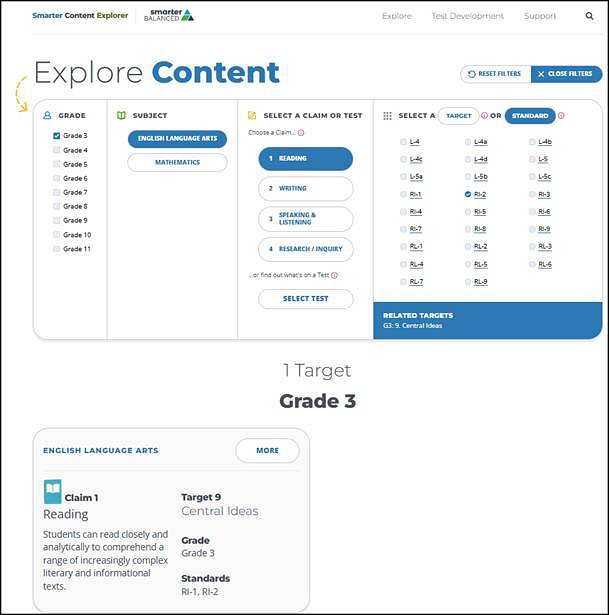
Figure 13. Details from the Content Explorer for Standard 3.RL.2
Ms. Garcia may also wish to explore more about the standards and the assessment target shown in figure 14. Some item guideline features are not pictured in figure 14, which include depth of knowledge, allowable item types, stimuli, and accessibility.
The Content Explorer resource paired with interim assessment results reports in CERS and professional learning resources found on the Tools for Teachers website can provide actionable instructional insights and strategies to address classroom needs.
More information can be found in section 3.3 Content Explorer and section 6.0 Tools for Teachers Interim Connections Playlists.
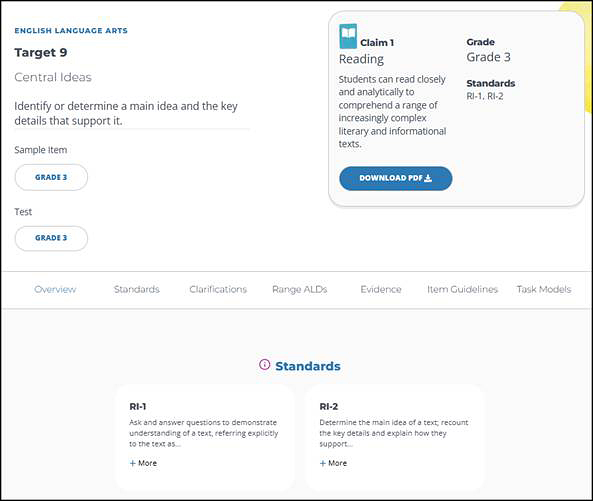
Figure 14. Content Explorer Item Guideline Details